| Image | Map Category | Dataset Name | Vector or Raster | County or Region | Ground Condition Year | Ground Condition Season | Data Publishing Year | Funder | Description | Raster Spatial Resolution | Raster Data | Feature Class | Feature or Image Service | Tile Service | Layer Package | Layer File | Watershed Downloads | Clip and Email Viewer | PDF Maps | Methods | Datasheet | Report | Other Info | Large Area Downloads | Other Field 1 | Other Field 2 | Other Field 3 | Details and Download |
|---|---|---|---|---|---|---|---|---|---|---|---|---|---|---|---|---|---|---|---|---|---|---|---|---|---|---|---|---|
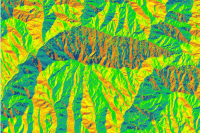 |
Topography | Aspect 1-meter | Raster | Alameda | Various | Various | 2023 | CAL FIRE, East Bay Regional Park District, and USGS | This raster covers Alameda and Contra Costa counties. In this map, aspect (or slope direction) shows the downslope direction of the maximum rate of change in elevation value from each 1m x 1m cell to its neighbors. | 1 meter | Click Here | |||||||||||||||||
 |
Forest Structure | Canopy Cover 1-meter | Raster | Alameda | Various | Various | 2023 | CAL FIRE, East Bay Regional Park District, and USGS | The canopy cover raster of Alameda and Contra Costa counties that represents areas of tree canopy greater than or equal to 15 feet in height with a 1, and all other areas with a 0. | 1 meter | Click Here | |||||||||||||||||
 |
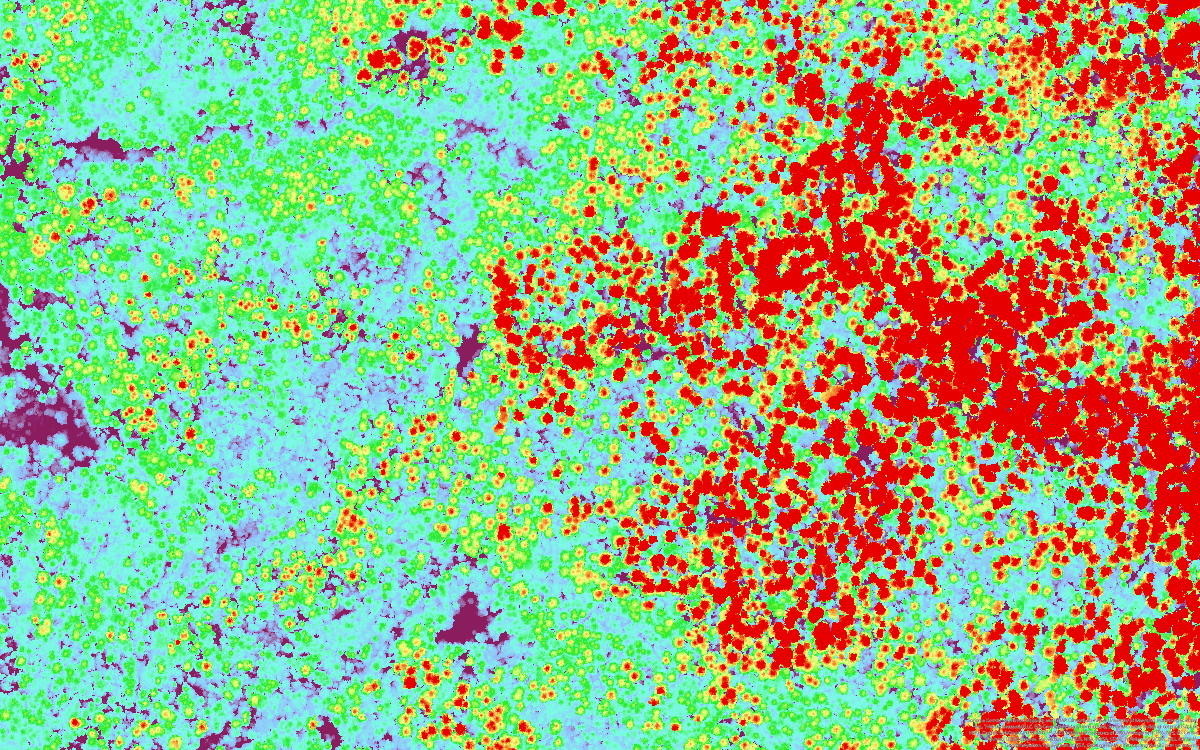
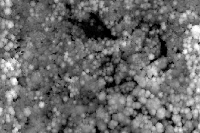
Forest Structure | Canopy Height Model 1-meter | Raster | Alameda | Various | Various | 2023 | CAL FIRE, East Bay Regional Park District, and USGS | This raster covers Alameda and Contra Costa counties. Pixel values represent the aboveground height of vegetation and trees. | 1 meter | Click Here | |||||||||||||||||
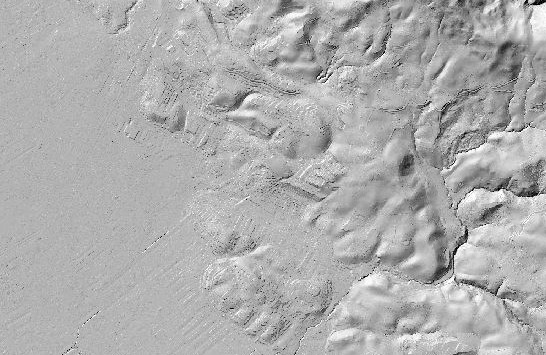 |
Topography | Digital Terrain Model 1-meter | Raster | Alameda | Various | Various | 2023 | CAL FIRE, East Bay Regional Park District, and USGS | This raster covers Alameda and Contra Costa counties. It represents elevation above sea level (in feet) for each 1m x 1m cell. | 1 meter | Click Here | |||||||||||||||||
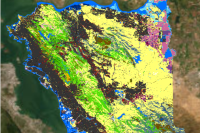 |
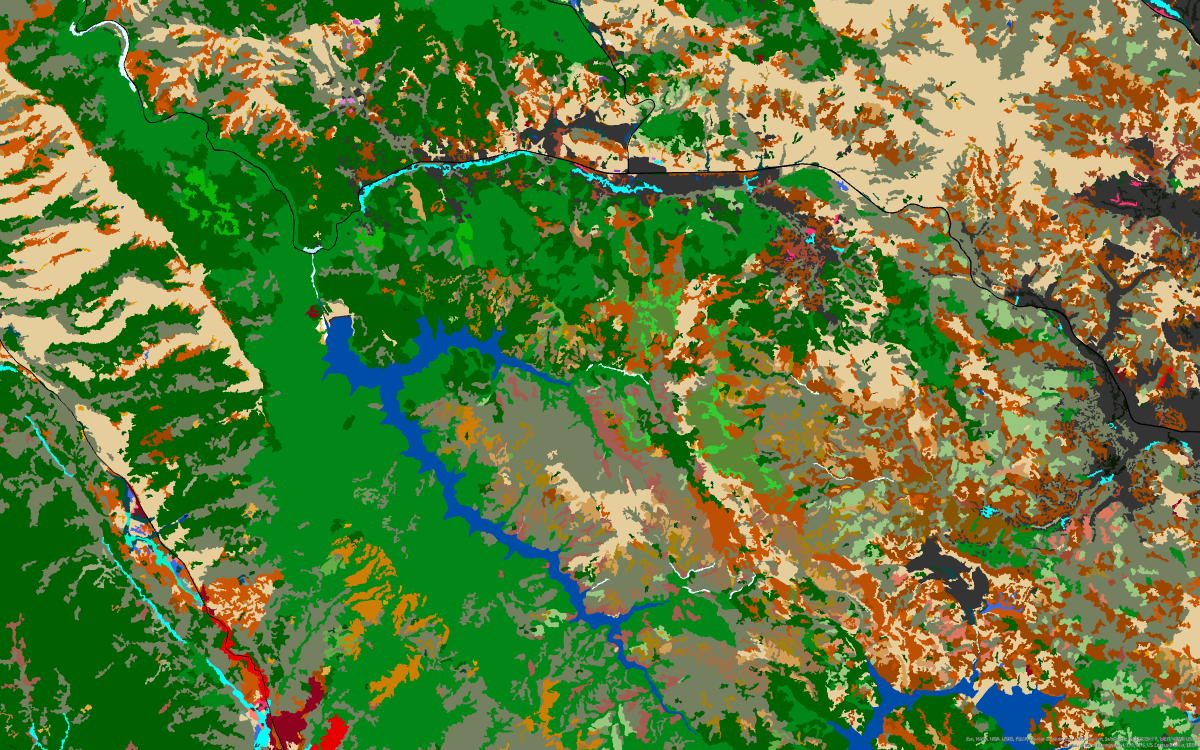
Land Cover and Fine Scale Veg | Draft - Enhanced Lifeform Map | Vector | Alameda | 2020 | Summer | 2023 | CAL FIRE & East Bay Regional Park District | 26-class land use and land cover map of Alameda and Contra Costa Counties | Click Here | Click Here | Click Here | ||||||||||||||||
 |
Topography | Hillshade 1-meter | Raster | Alameda | Various | Various | 2023 | CAL FIRE, East Bay Regional Park District, and USGS | 1-meter resoution hillshade depicts shaded relief based on the Digital Terrain Model for Alameda and Contra Costa counties. | 1 meter | Click Here | |||||||||||||||||
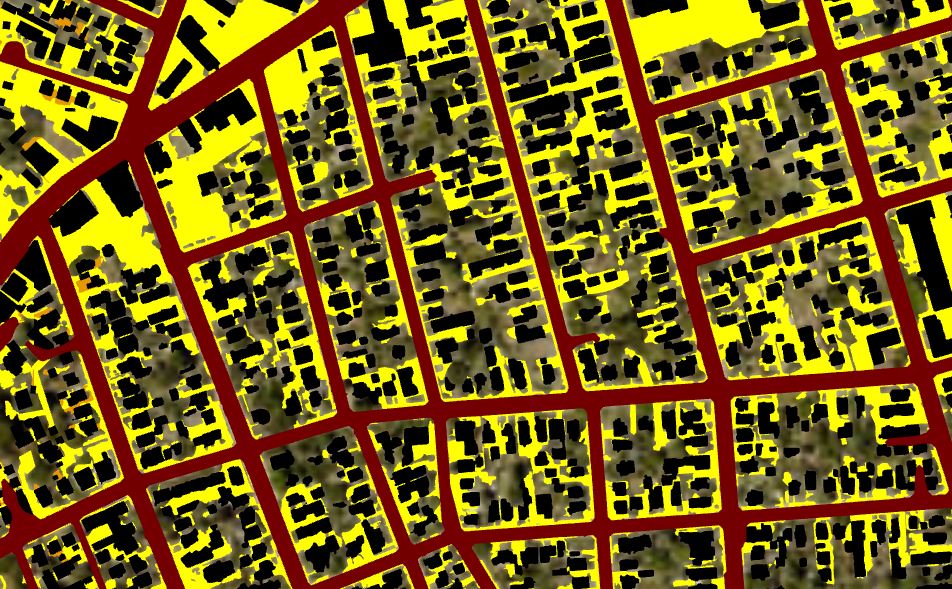 |
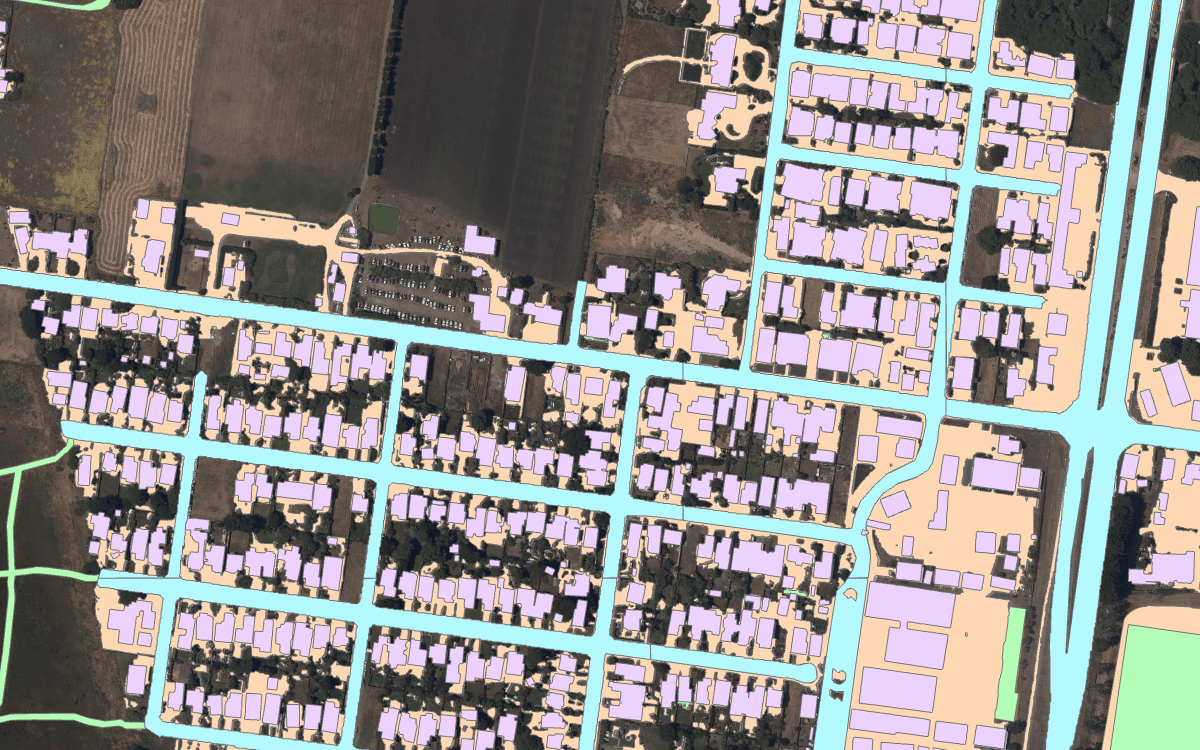
Built | Impervious Surfaces | Vector | Alameda | 2020 | Summer | 2023 | CAL FIRE & East Bay Regional Park District | The impervious map is a fine-scale polygon vector representation of all artificial impervious surfaces in Alameda and Contra Costa Counties. | Click Here | Click Here |  |
||||||||||||||||
 |
Fuels/Fire | Ladder Fuels 20-meter | Raster | Alameda | Various | Various | 2023 | CAL FIRE, East Bay Regional Park District, and USGS | This raster provides information about the density of living and dead vegetation in the vertical stratum between 1 and 4 meters above the ground for Alameda and Contra Costa Counties. Recent research has shown that LiDAR metrics that characterize this stratum provide a useful proxy for ladder fuels. | 20 meters | Click Here | |||||||||||||||||
 |
Topography | Slope Degrees 1-meter | Raster | Alameda | Various | Various | 2023 | CAL FIRE, East Bay Regional Park District, and USGS | This raster covers Alameda and Contra Costa counties. It represents steepness of the ground in degrees for each 1-meter x 1-meter raster cell. Units in degrees. | 1 meter | Click Here | |||||||||||||||||
 |
Topography | Slope Percent 1-meter | Raster | Alameda | Various | Various | 2023 | CAL FIRE, East Bay Regional Park District, and USGS | This raster covers Alameda and Contra Costa counties. It represents steepness of the ground in degrees for each 1-meter x 1-meter raster cell. Units in percentage rise. | 1 meter | Click Here | |||||||||||||||||
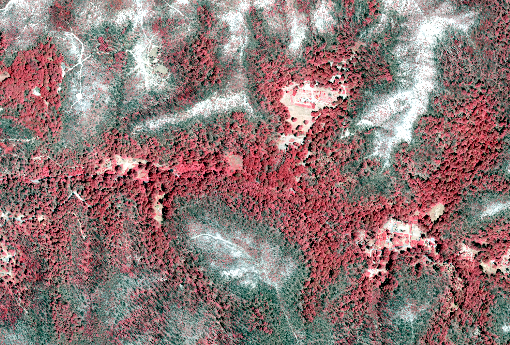 |
Fuels/Fire | Relative Wildfire Hazard | Raster | Alameda | Various | Various | 2023 | CAL FIRE, East Bay Regional Park District | Modelled classified relative 20-meter wildfire hazard map for Alameda and Contra Costa Counties. | 20 meters | Click Here | Click Here | Click Here | Web Map | ||||||||||||||
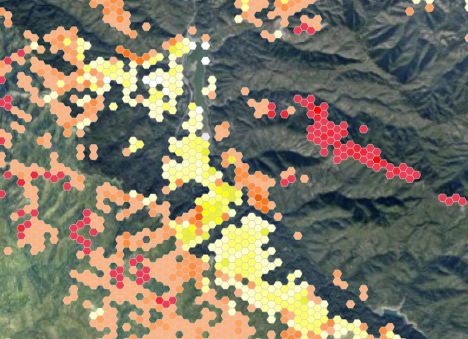 |
Fuels/Fire | Wildfire Risk to Structures | Vector | Alameda | Various | Various | 2023 | CAL FIRE, East Bay Regional Park District | Modelled classified relative wildfire risk to structures as 10-acre vector polygons (hexagons) for San Mateo, Santa Cruz and Santa Clara Counties | Click Here | Click Here | Click Here | Web Map | |||||||||||||||
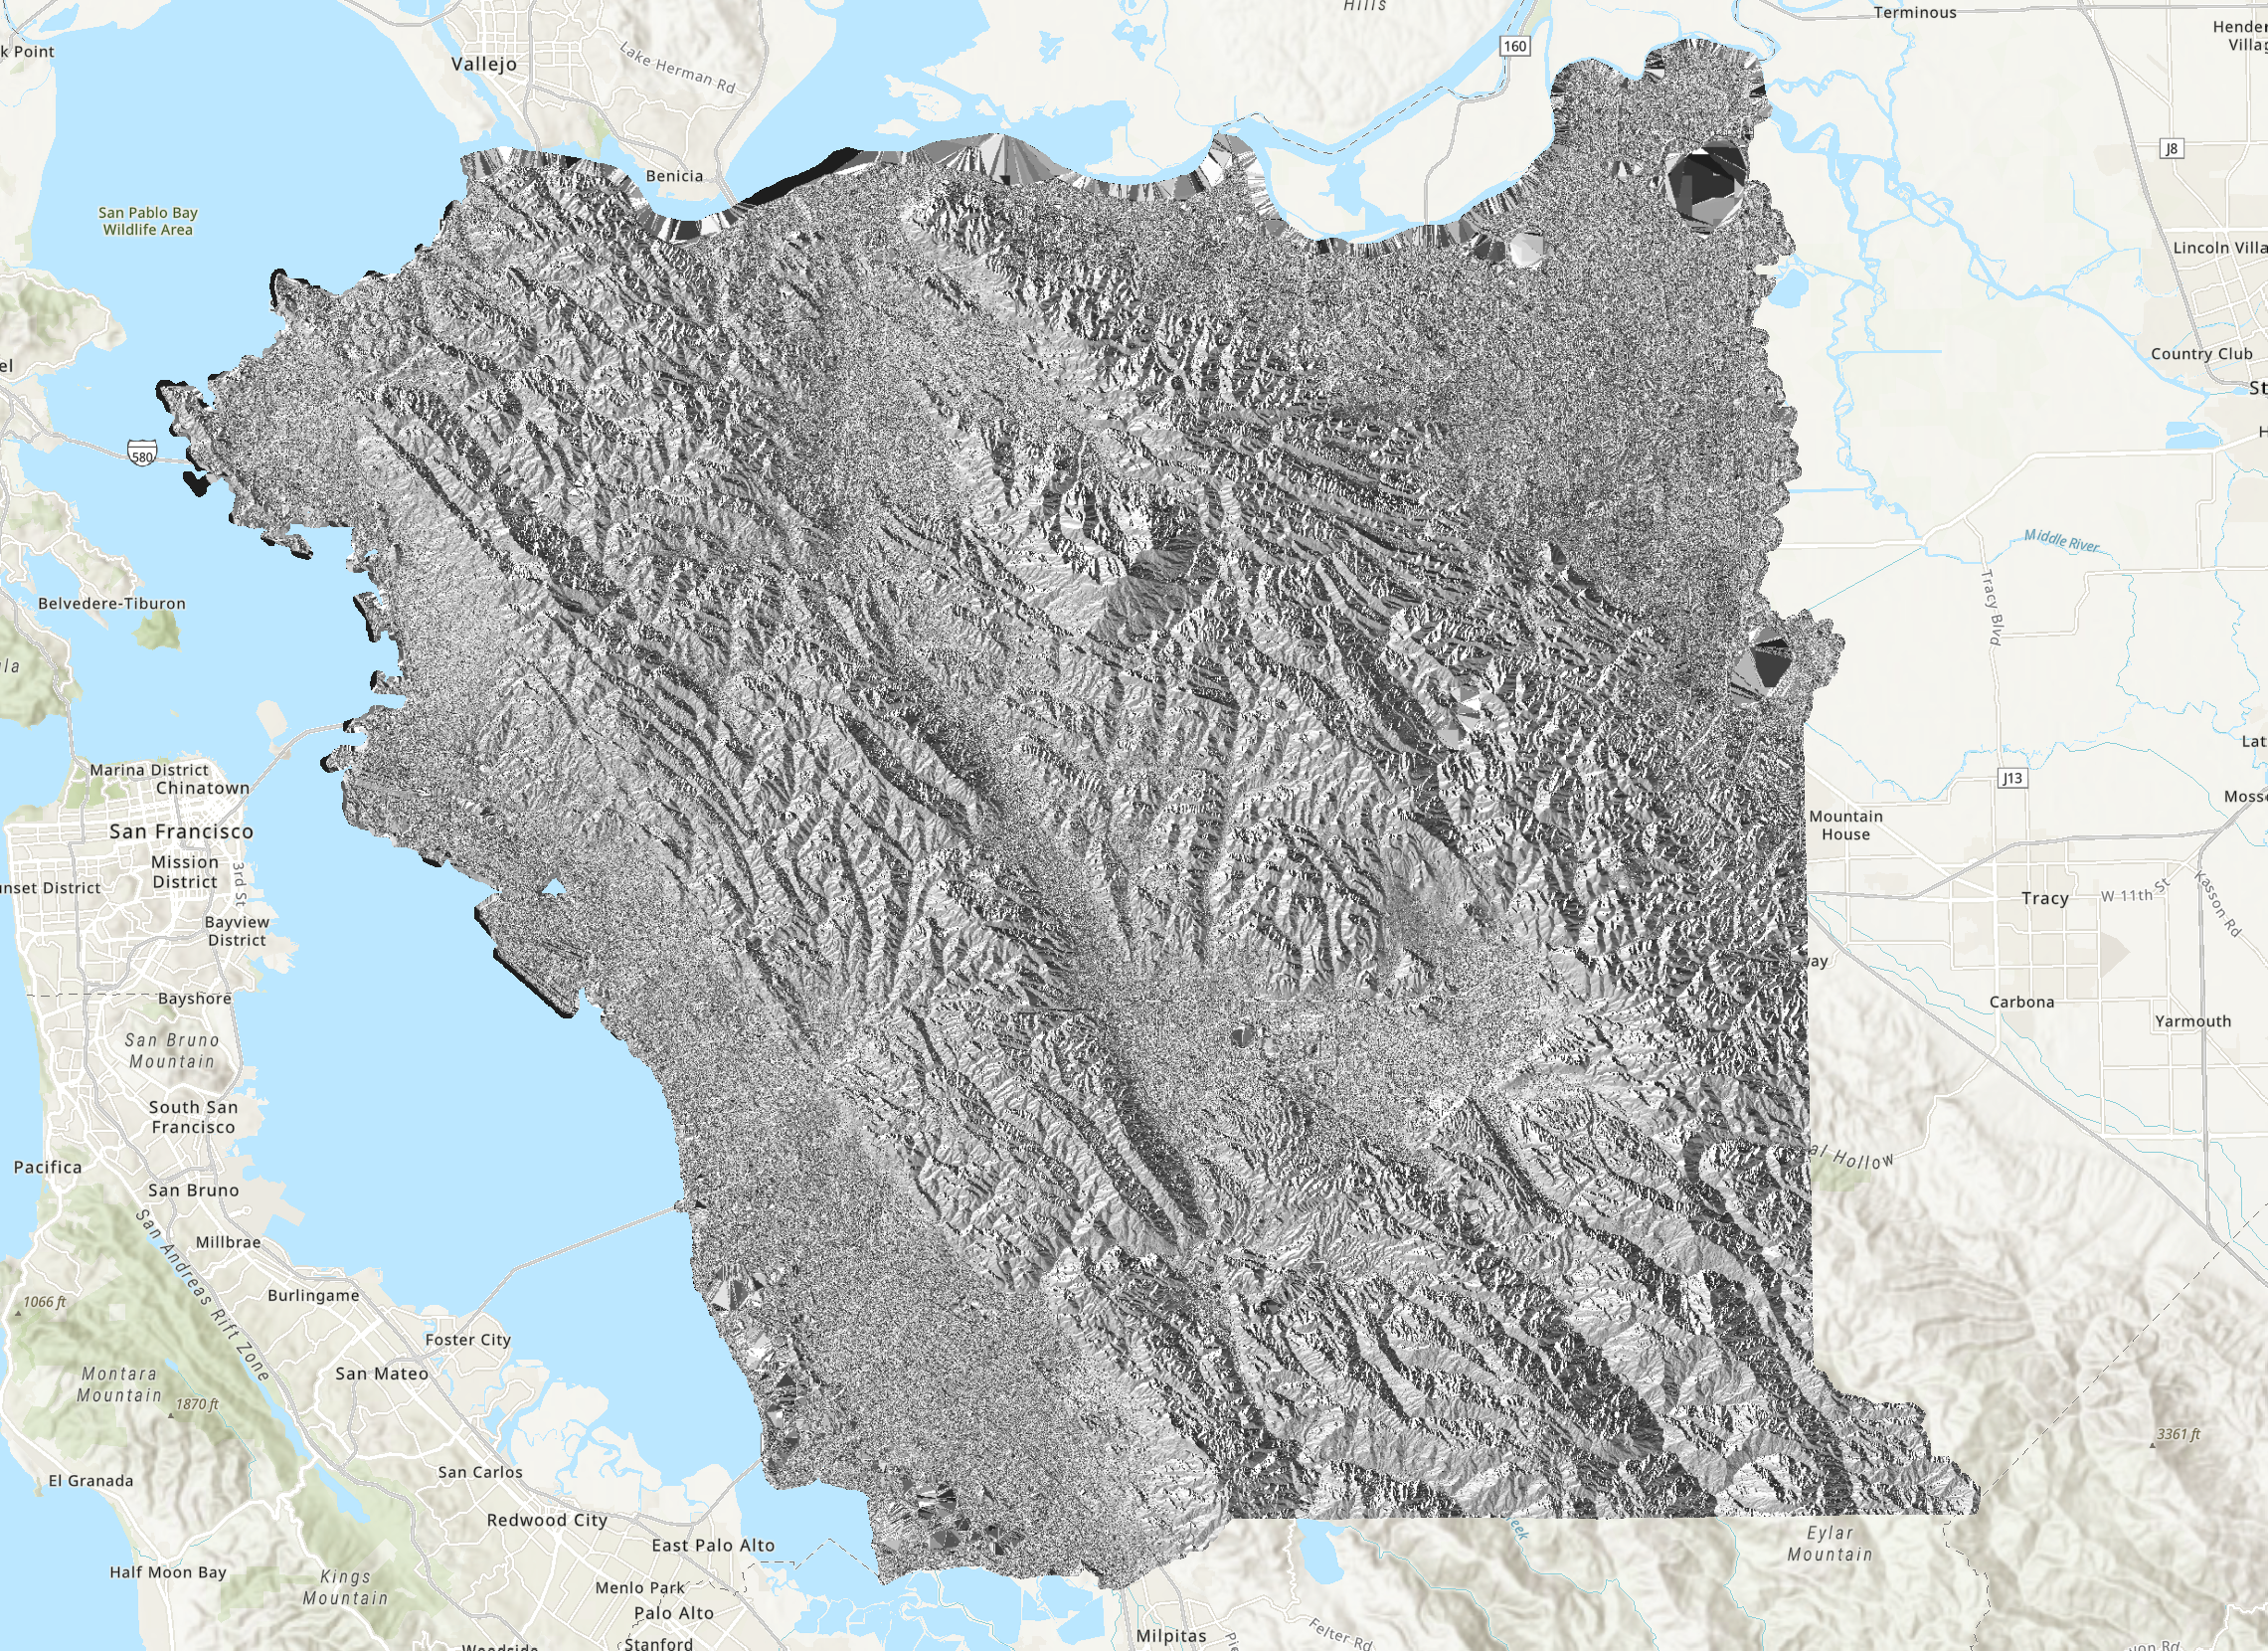 |
Fuels/Fire | Aspect 5-meter | Raster | Alameda | Various | Various | 2023 | This raster covers Alameda and Contra Costa counties. In this map, aspect (or slope direction) shows the downslope direction of the maximum rate of change in elevation value from each 5m x 5m cell to its neighbors. | Click Here | |||||||||||||||||||
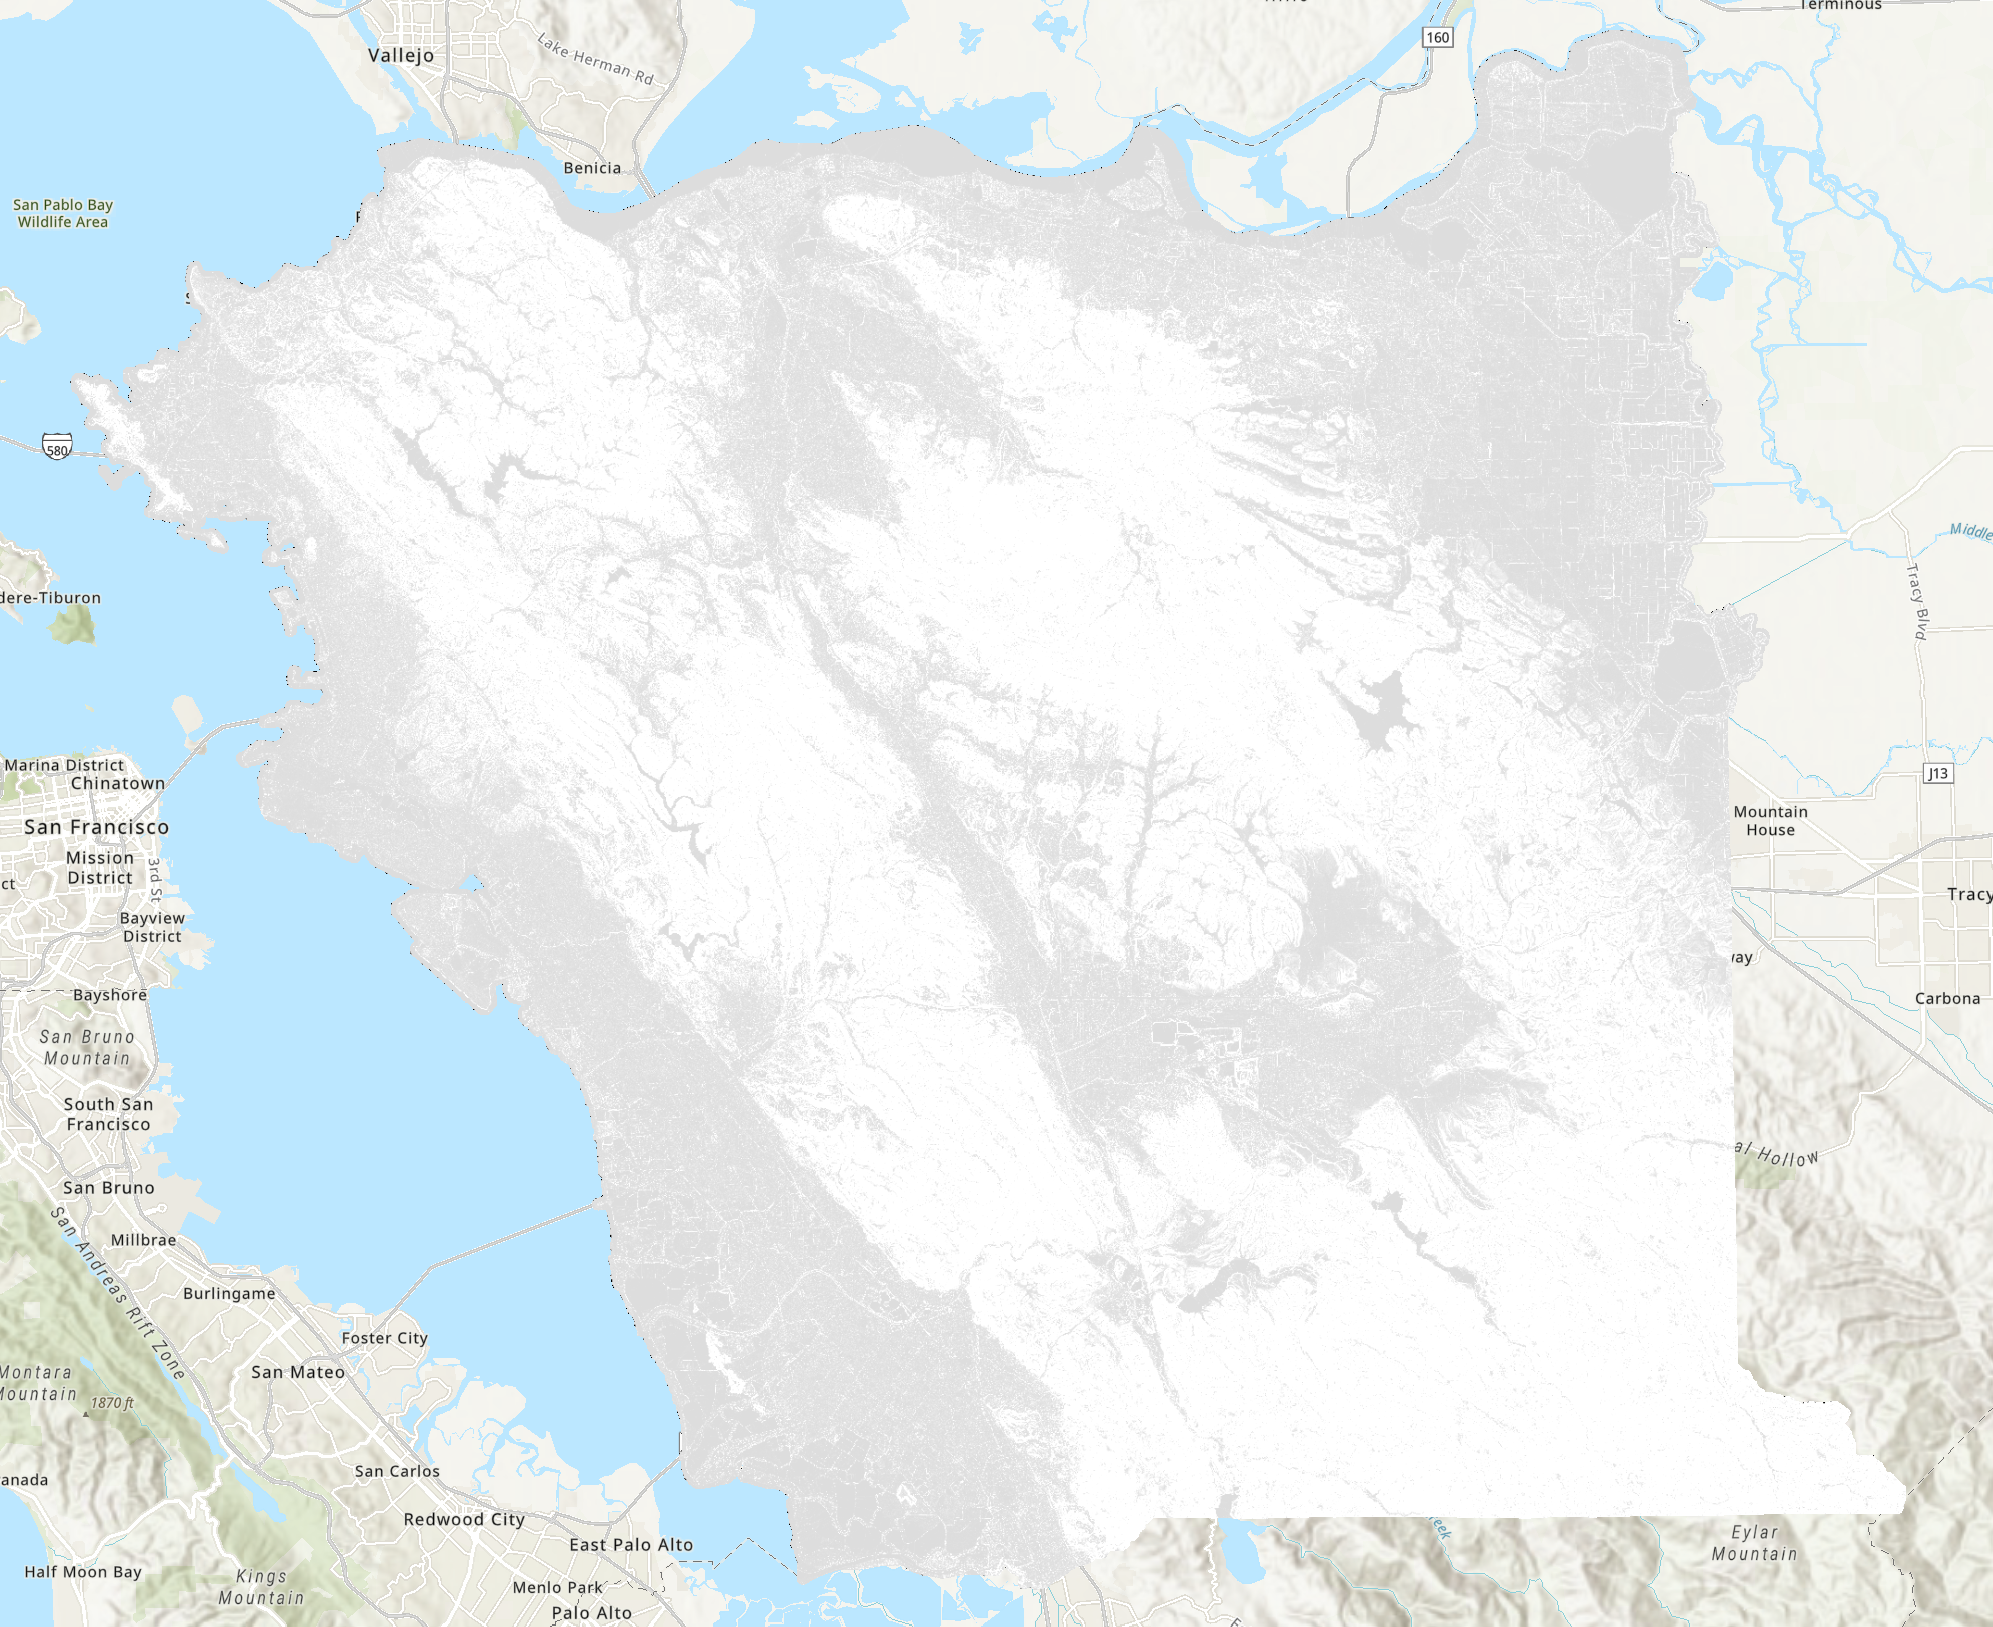 |
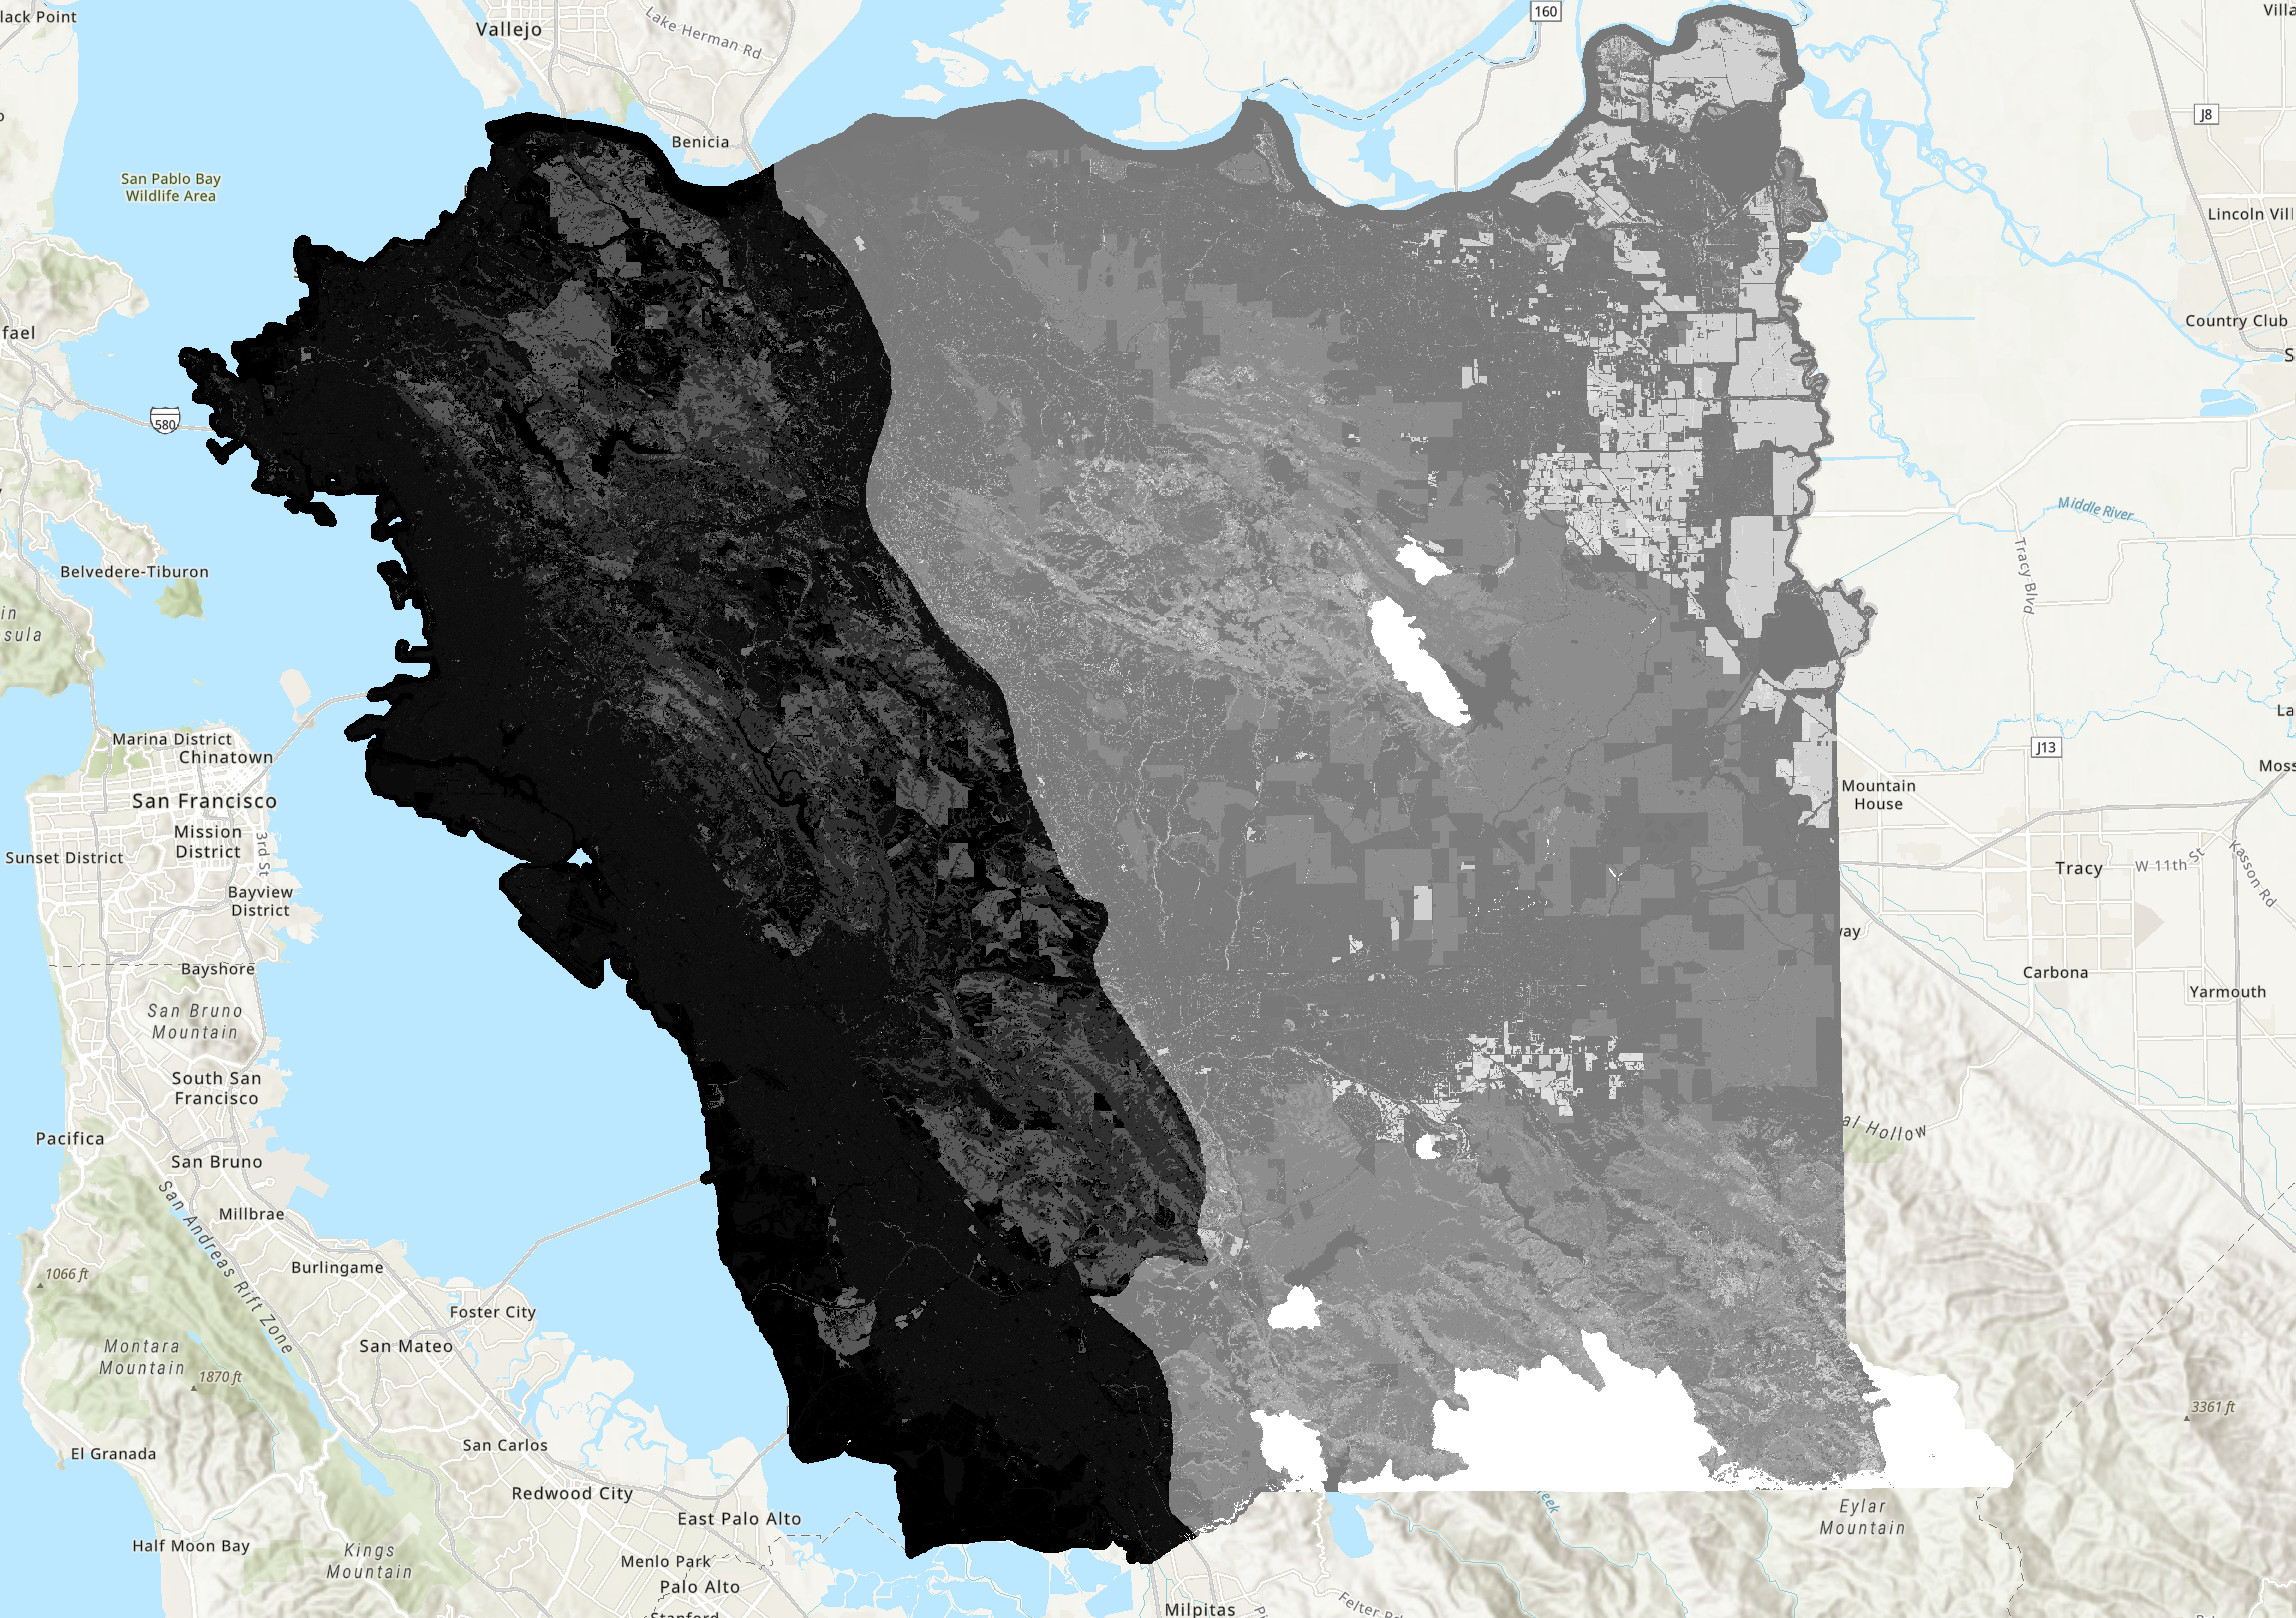
Fuels/Fire | Slope Degrees 5-meter | Raster | Alameda | Various | Various | 2023 | This raster covers Alameda and Contra Costa counties. It represents steepness of the ground in degrees for each 5-meter x 5-meter raster cell. Units in degrees. | Click Here | |||||||||||||||||||
 |
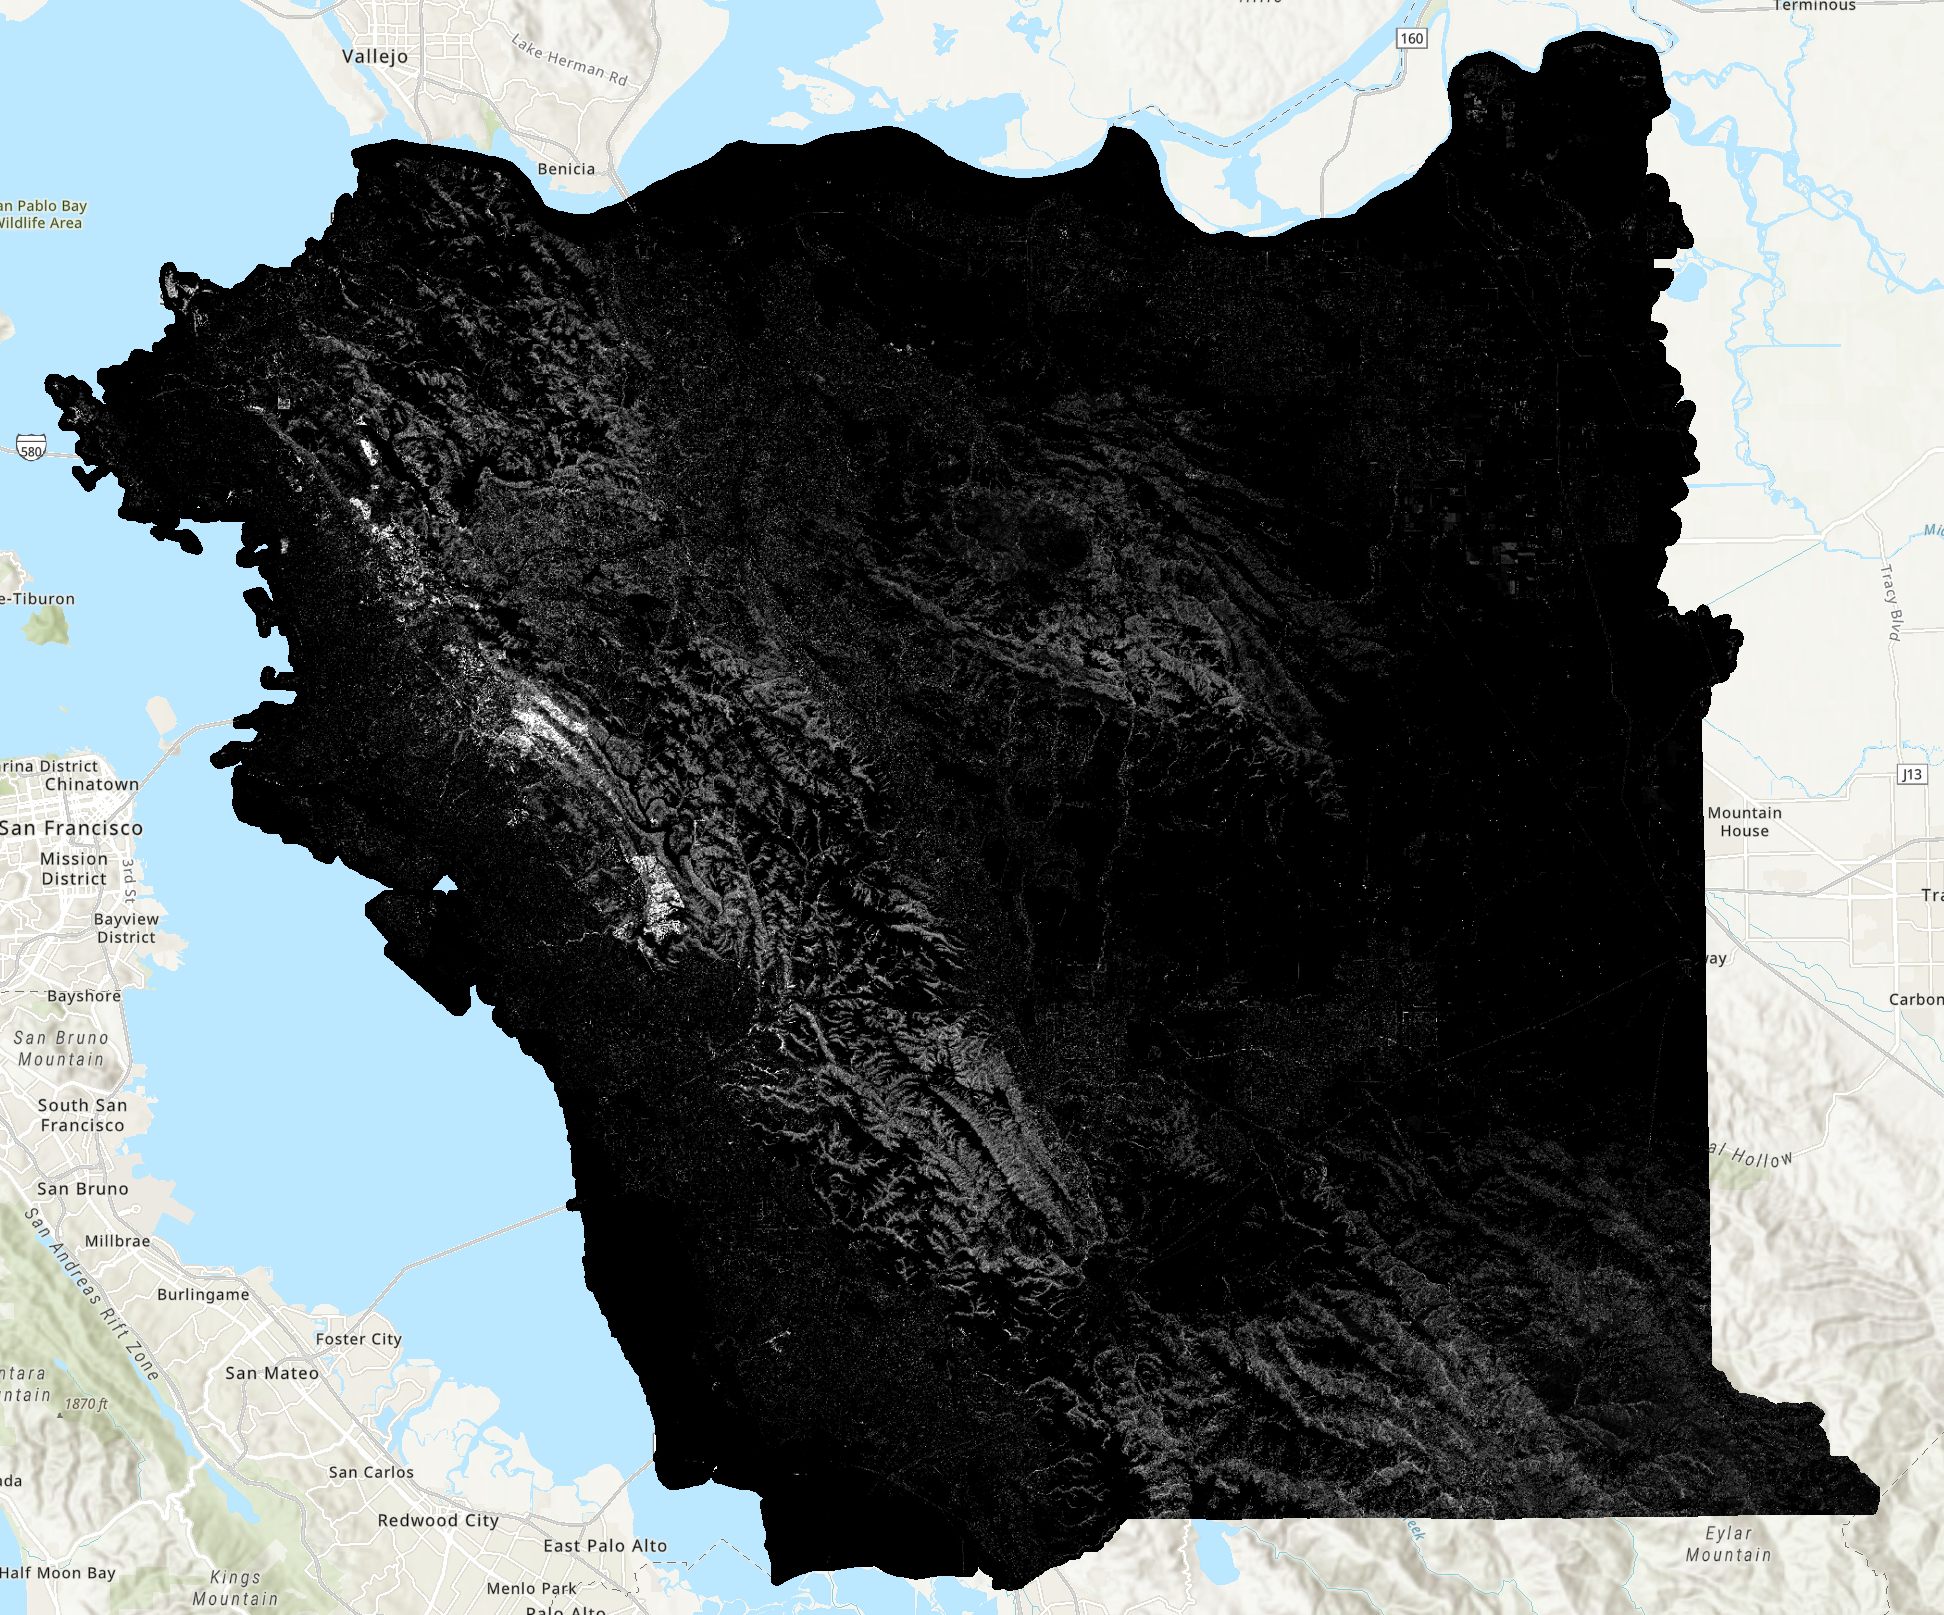
Fuels/Fire | Alameda County Fuel Model | Raster | Alameda | Various | Various | 2023 | This raster dataset is a 5-meter Scott and Burgan Fuel Model with Value Attribute Table, which contains fields for each component of the crosswalk. These are enhanced lifeform class (MapClass), canopy cover (AbsCover), ladder fuel (LadderFuel), canopy height (CanHeight), burn severity (BurnSeveri), pyrome (EastWest), fuel model as a numeric code (FuelModel) and fuel model as a string (FuelModTxt). | Click Here | |||||||||||||||||||
 |
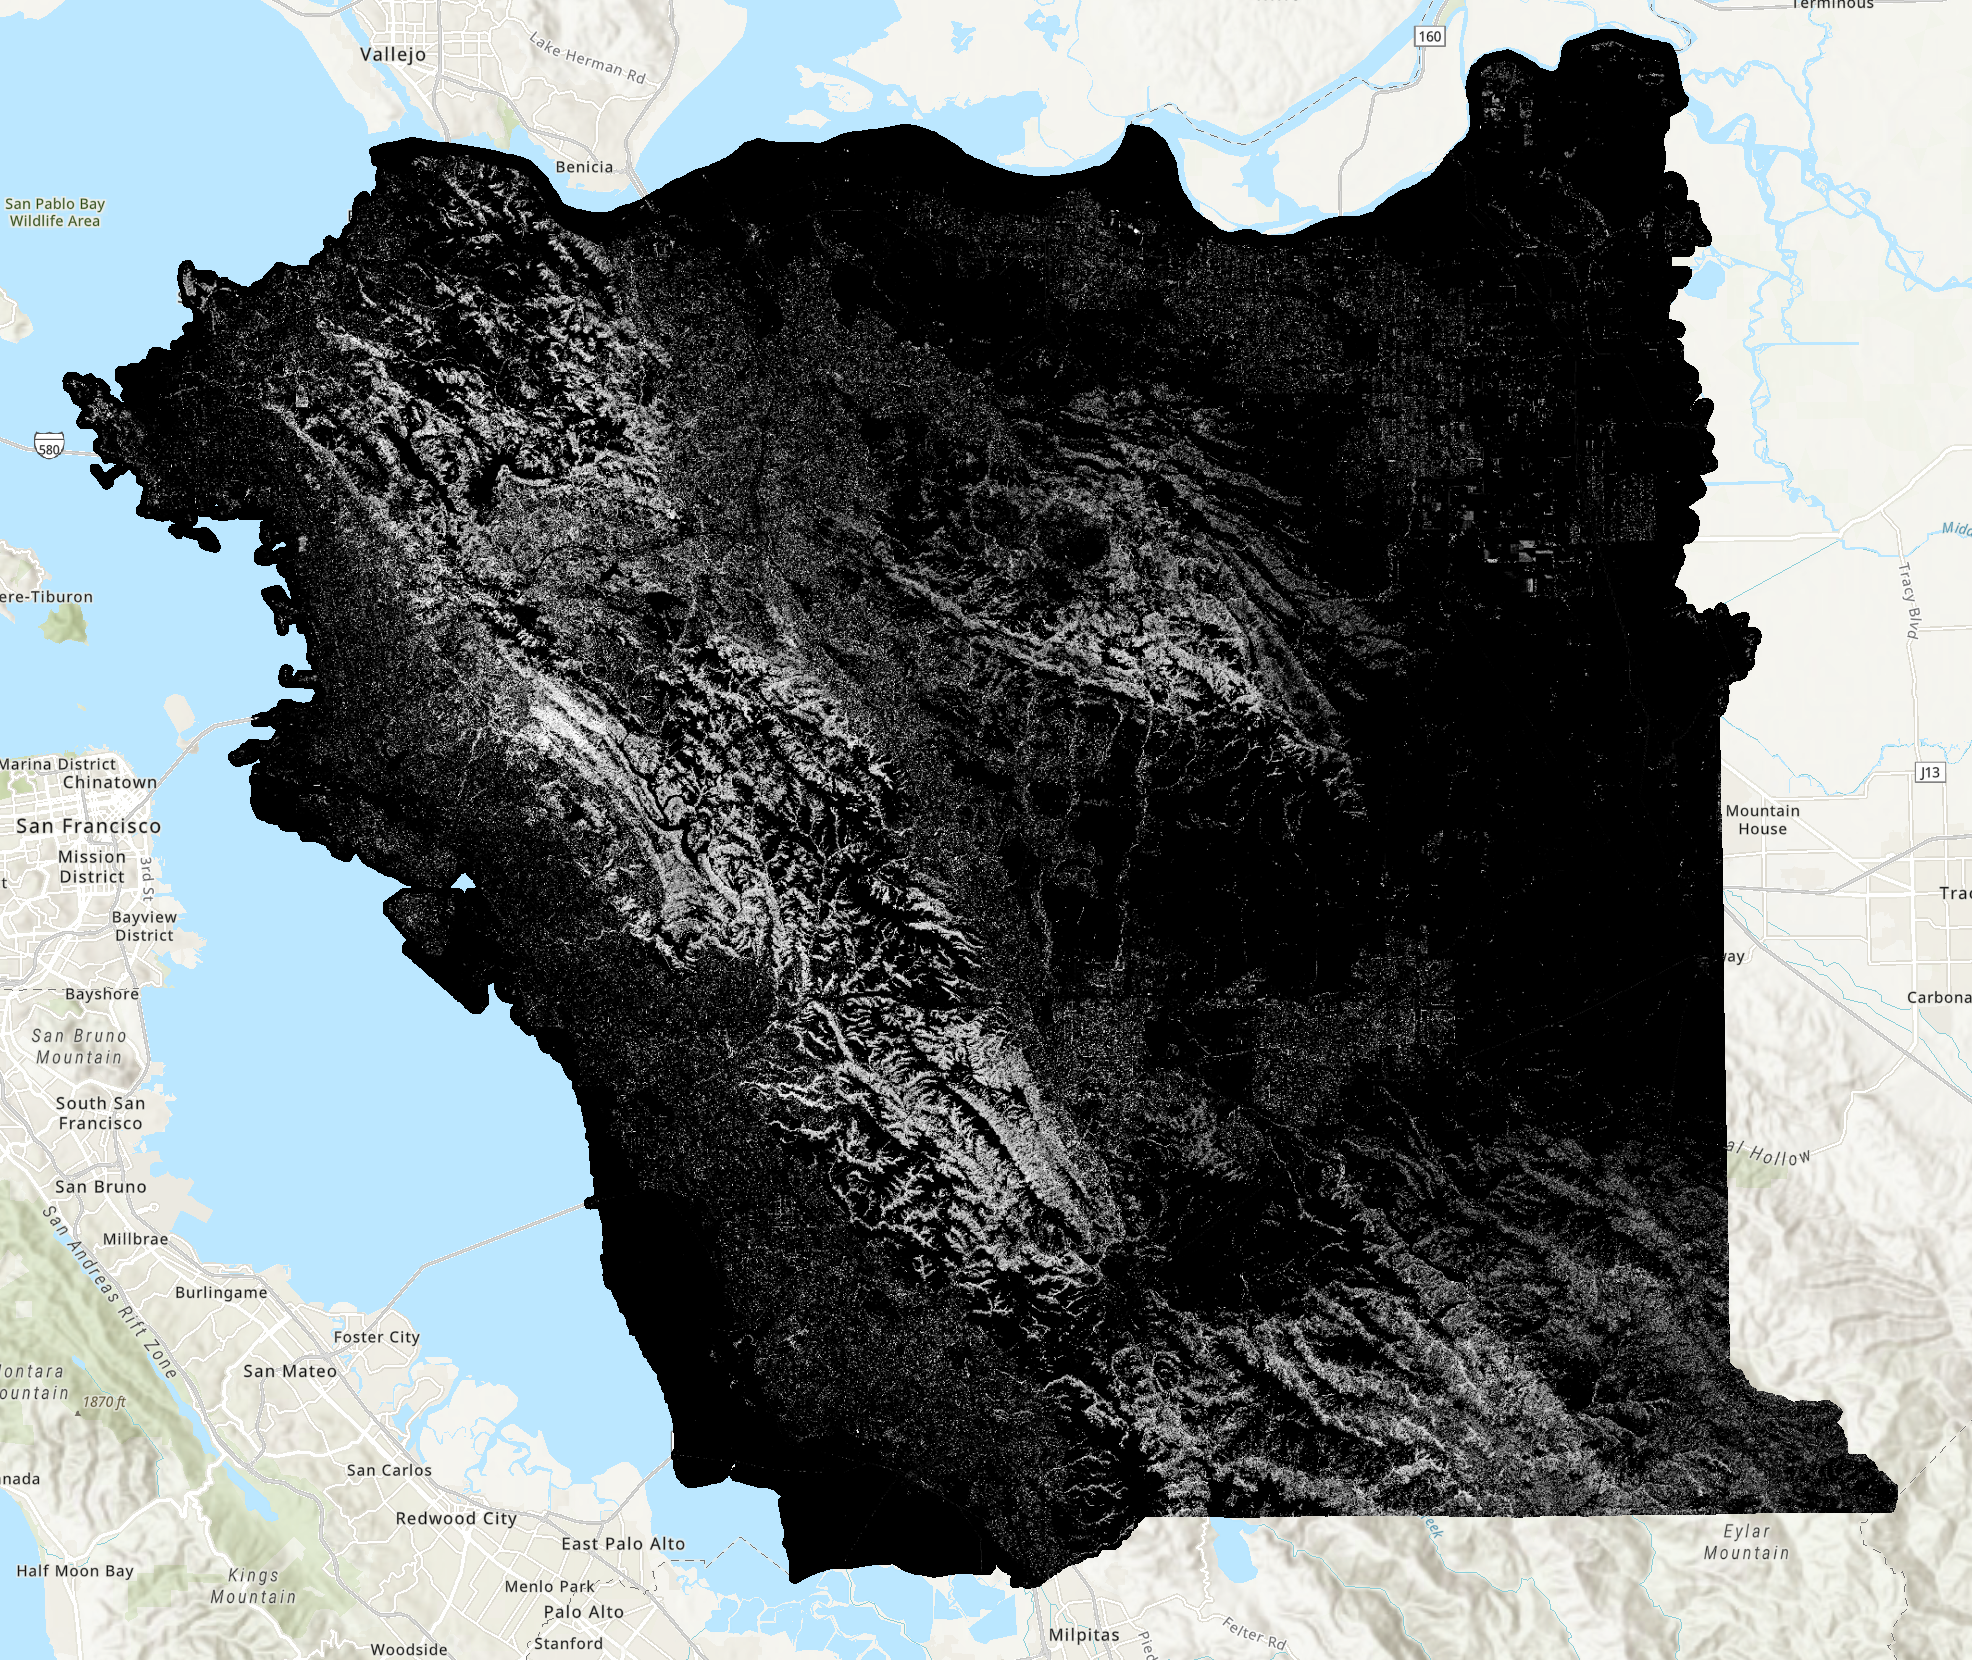
Fuels/Fire | Canopy Height Model 5-meter | Raster | Alameda | Various | Various | 2023 | This raster covers Alameda and Contra Costa counties. Pixel values represent the aboveground height of vegetation and trees. | Click Here | |||||||||||||||||||
 |
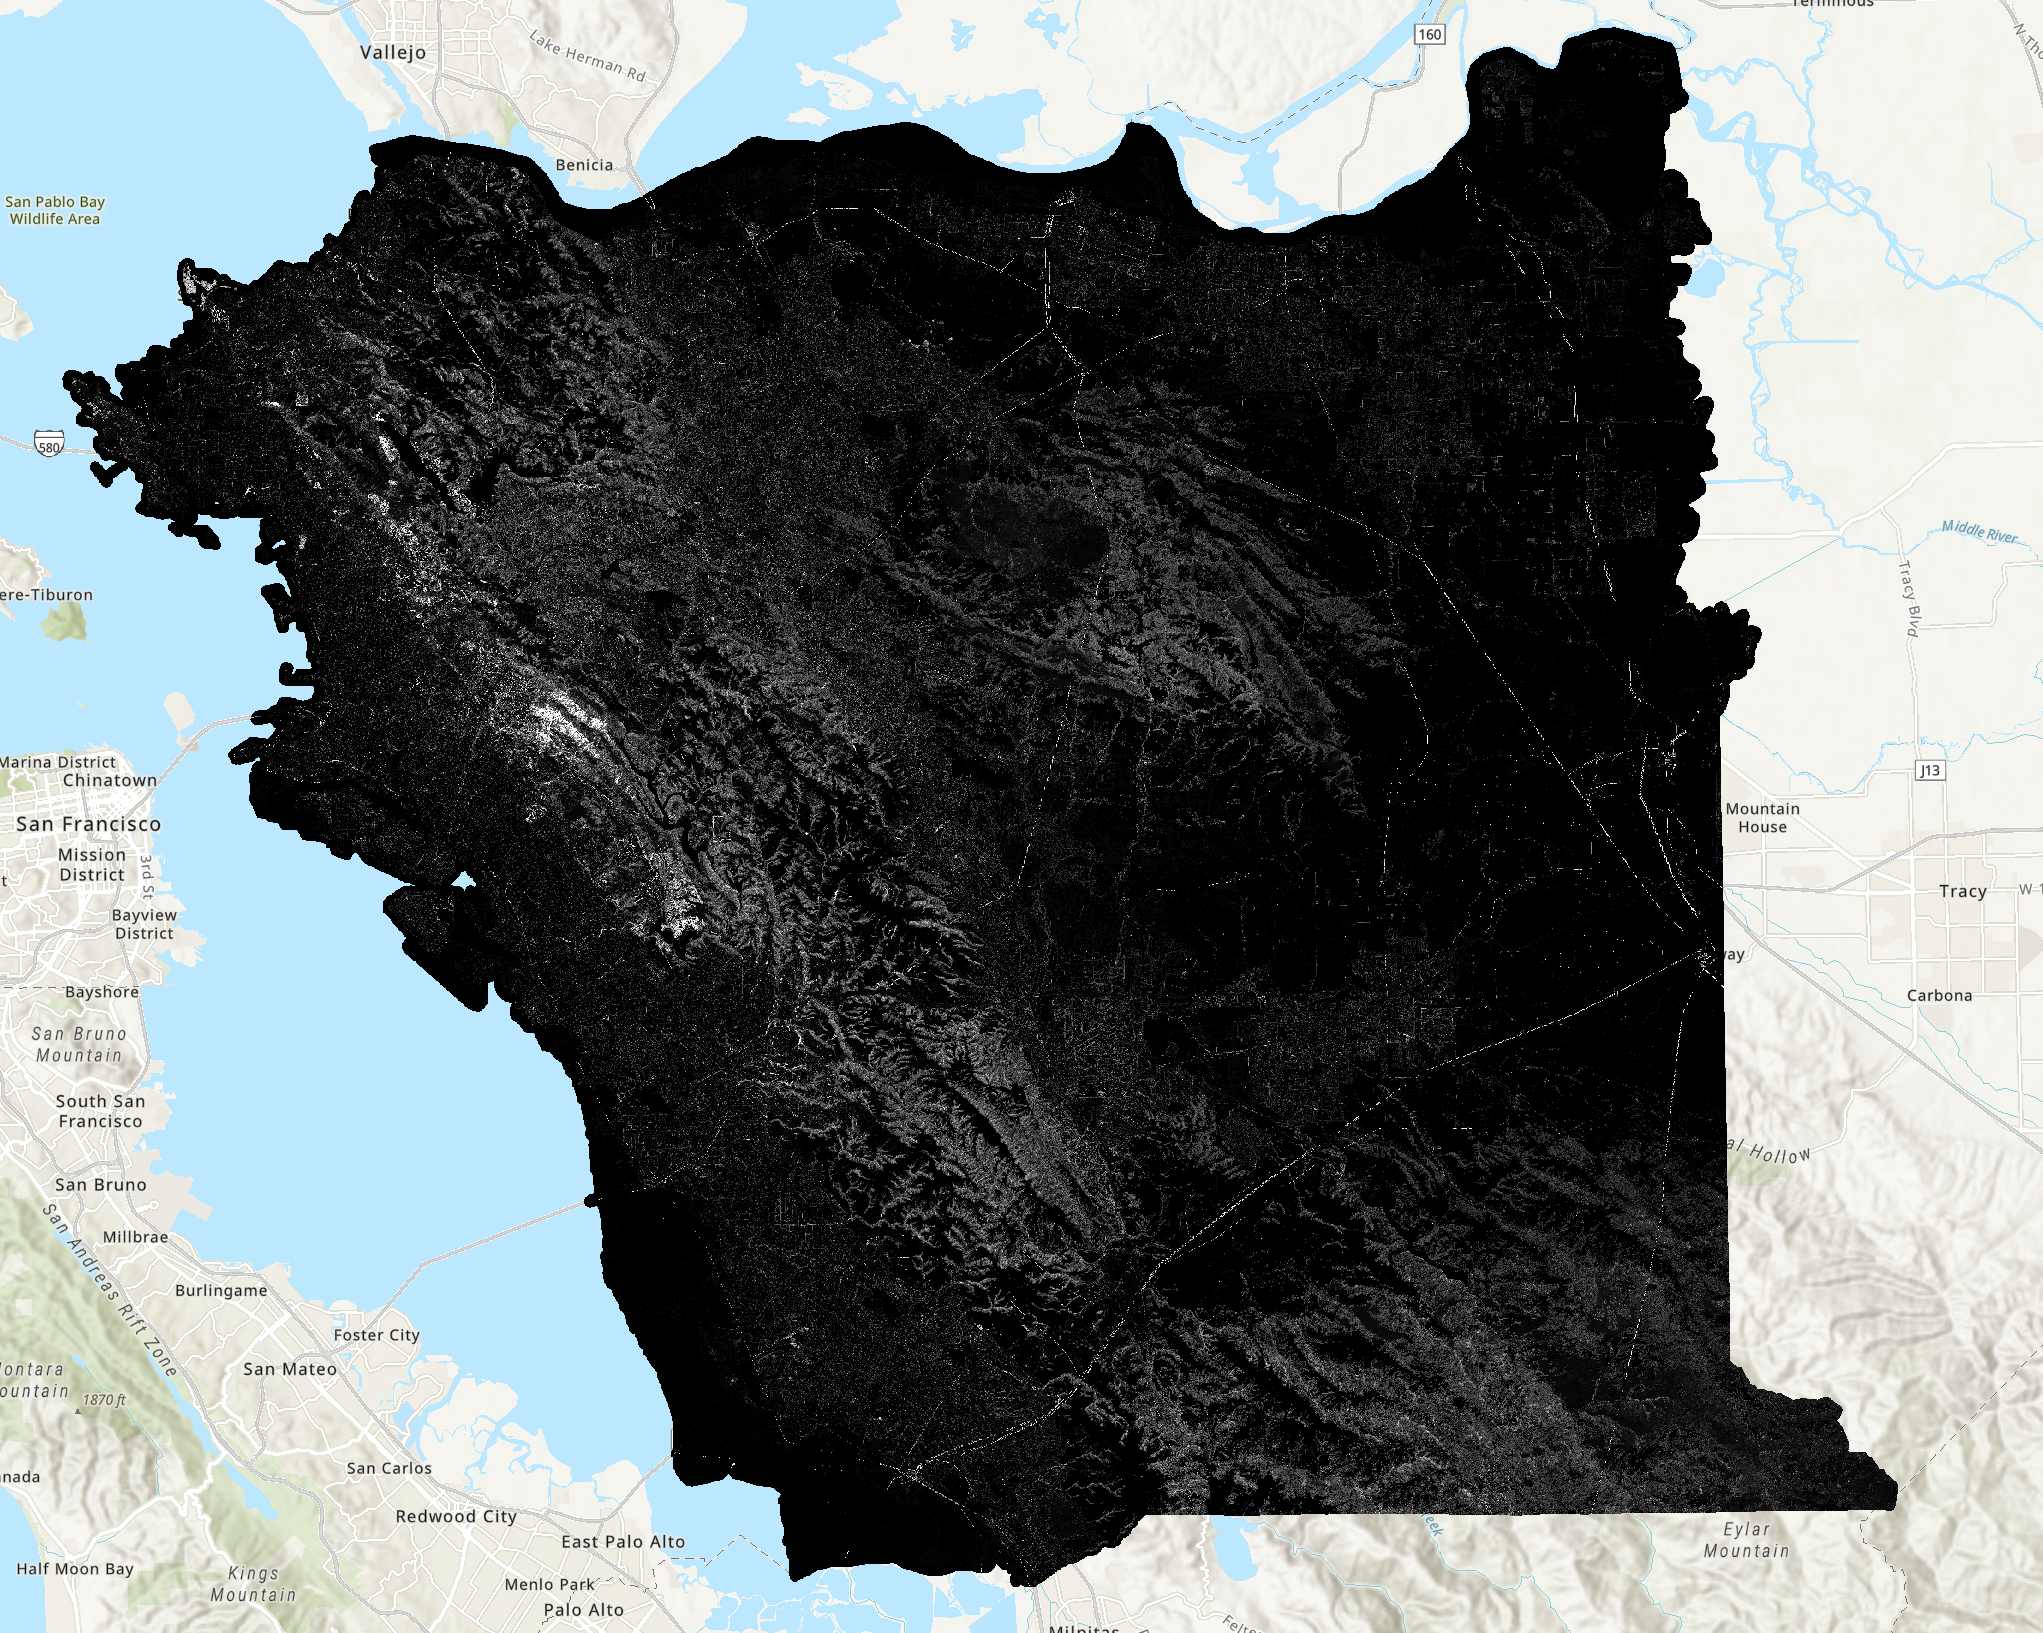
Fuels/Fire | Canopy Cover | Raster | Alameda | Various | Various | 2023 | This raster covers Alameda and Contra Costa counties. In this map pixel values represent the presence or absence of tree canopy or vegetation greater than or equal to 15 feet tall. | Click Here | |||||||||||||||||||
 |
Fuels/Fire | Canopy Base Height | Raster | Alameda | Various | Various | 2023 | In this 5-meter raster, pixel values represent the aboveground height of vegetation and trees. | Click Here | |||||||||||||||||||
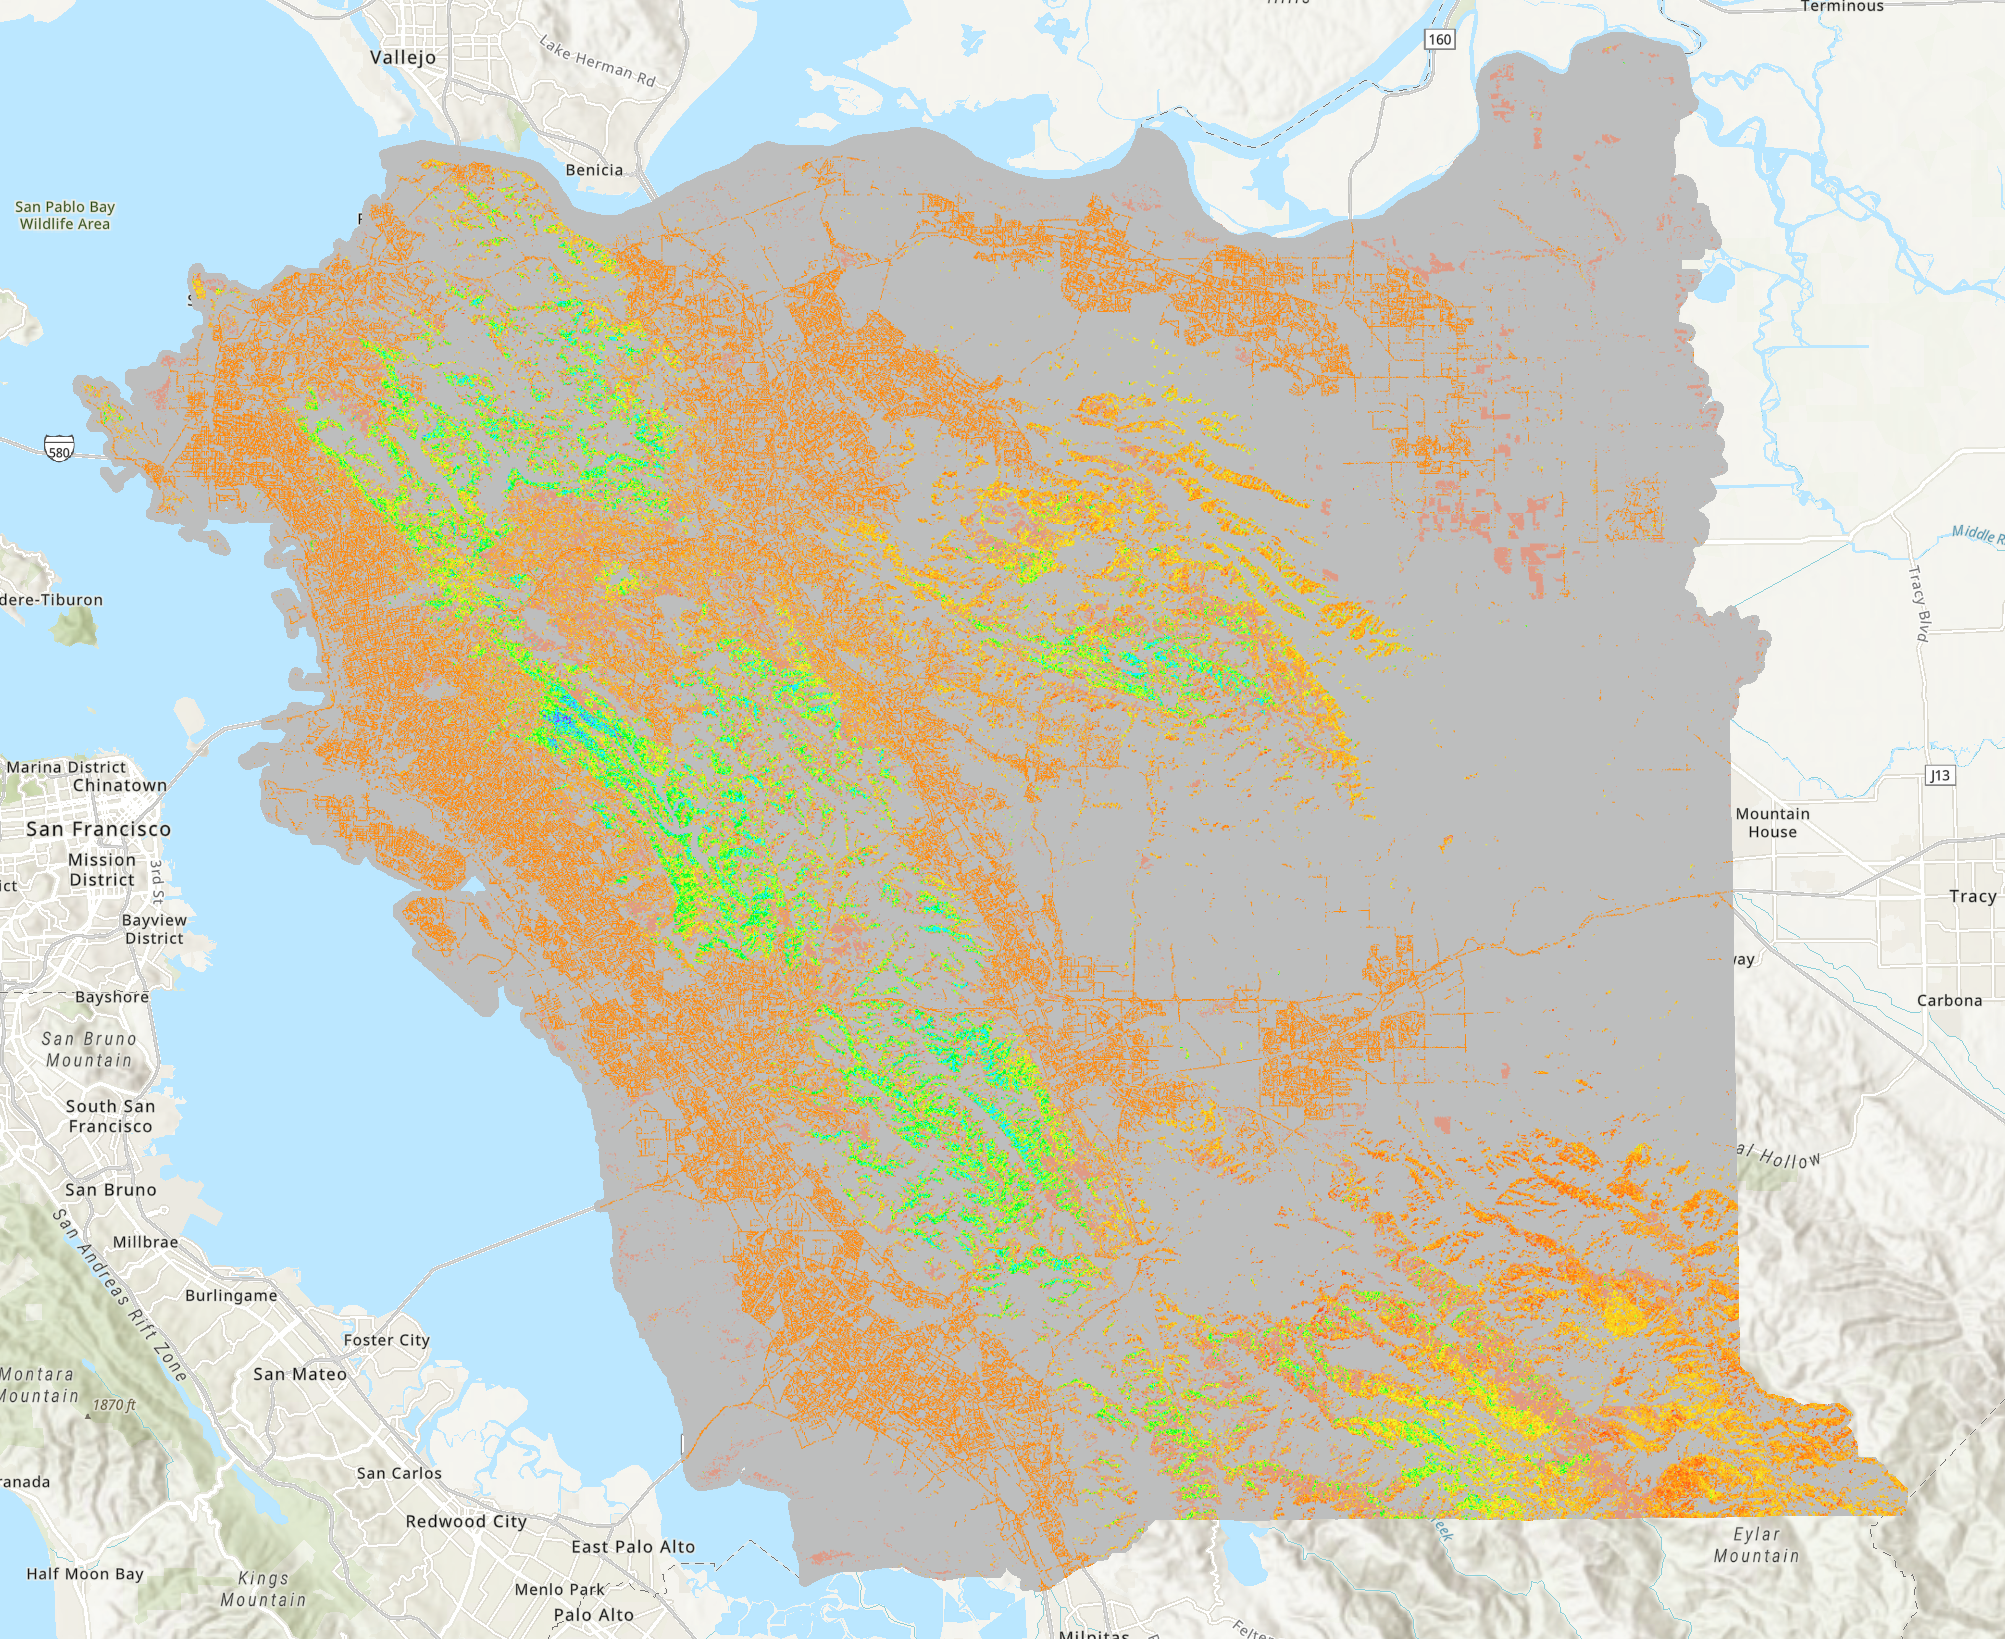 |
Fuels/Fire | Canopy Bulk Density | Raster | Alameda | Various | Various | 2023 | Canopy bulk density was derived from a statewide 30-meter resolution raster from Pyrologix, and resampled to 5 meters. | Click Here | |||||||||||||||||||
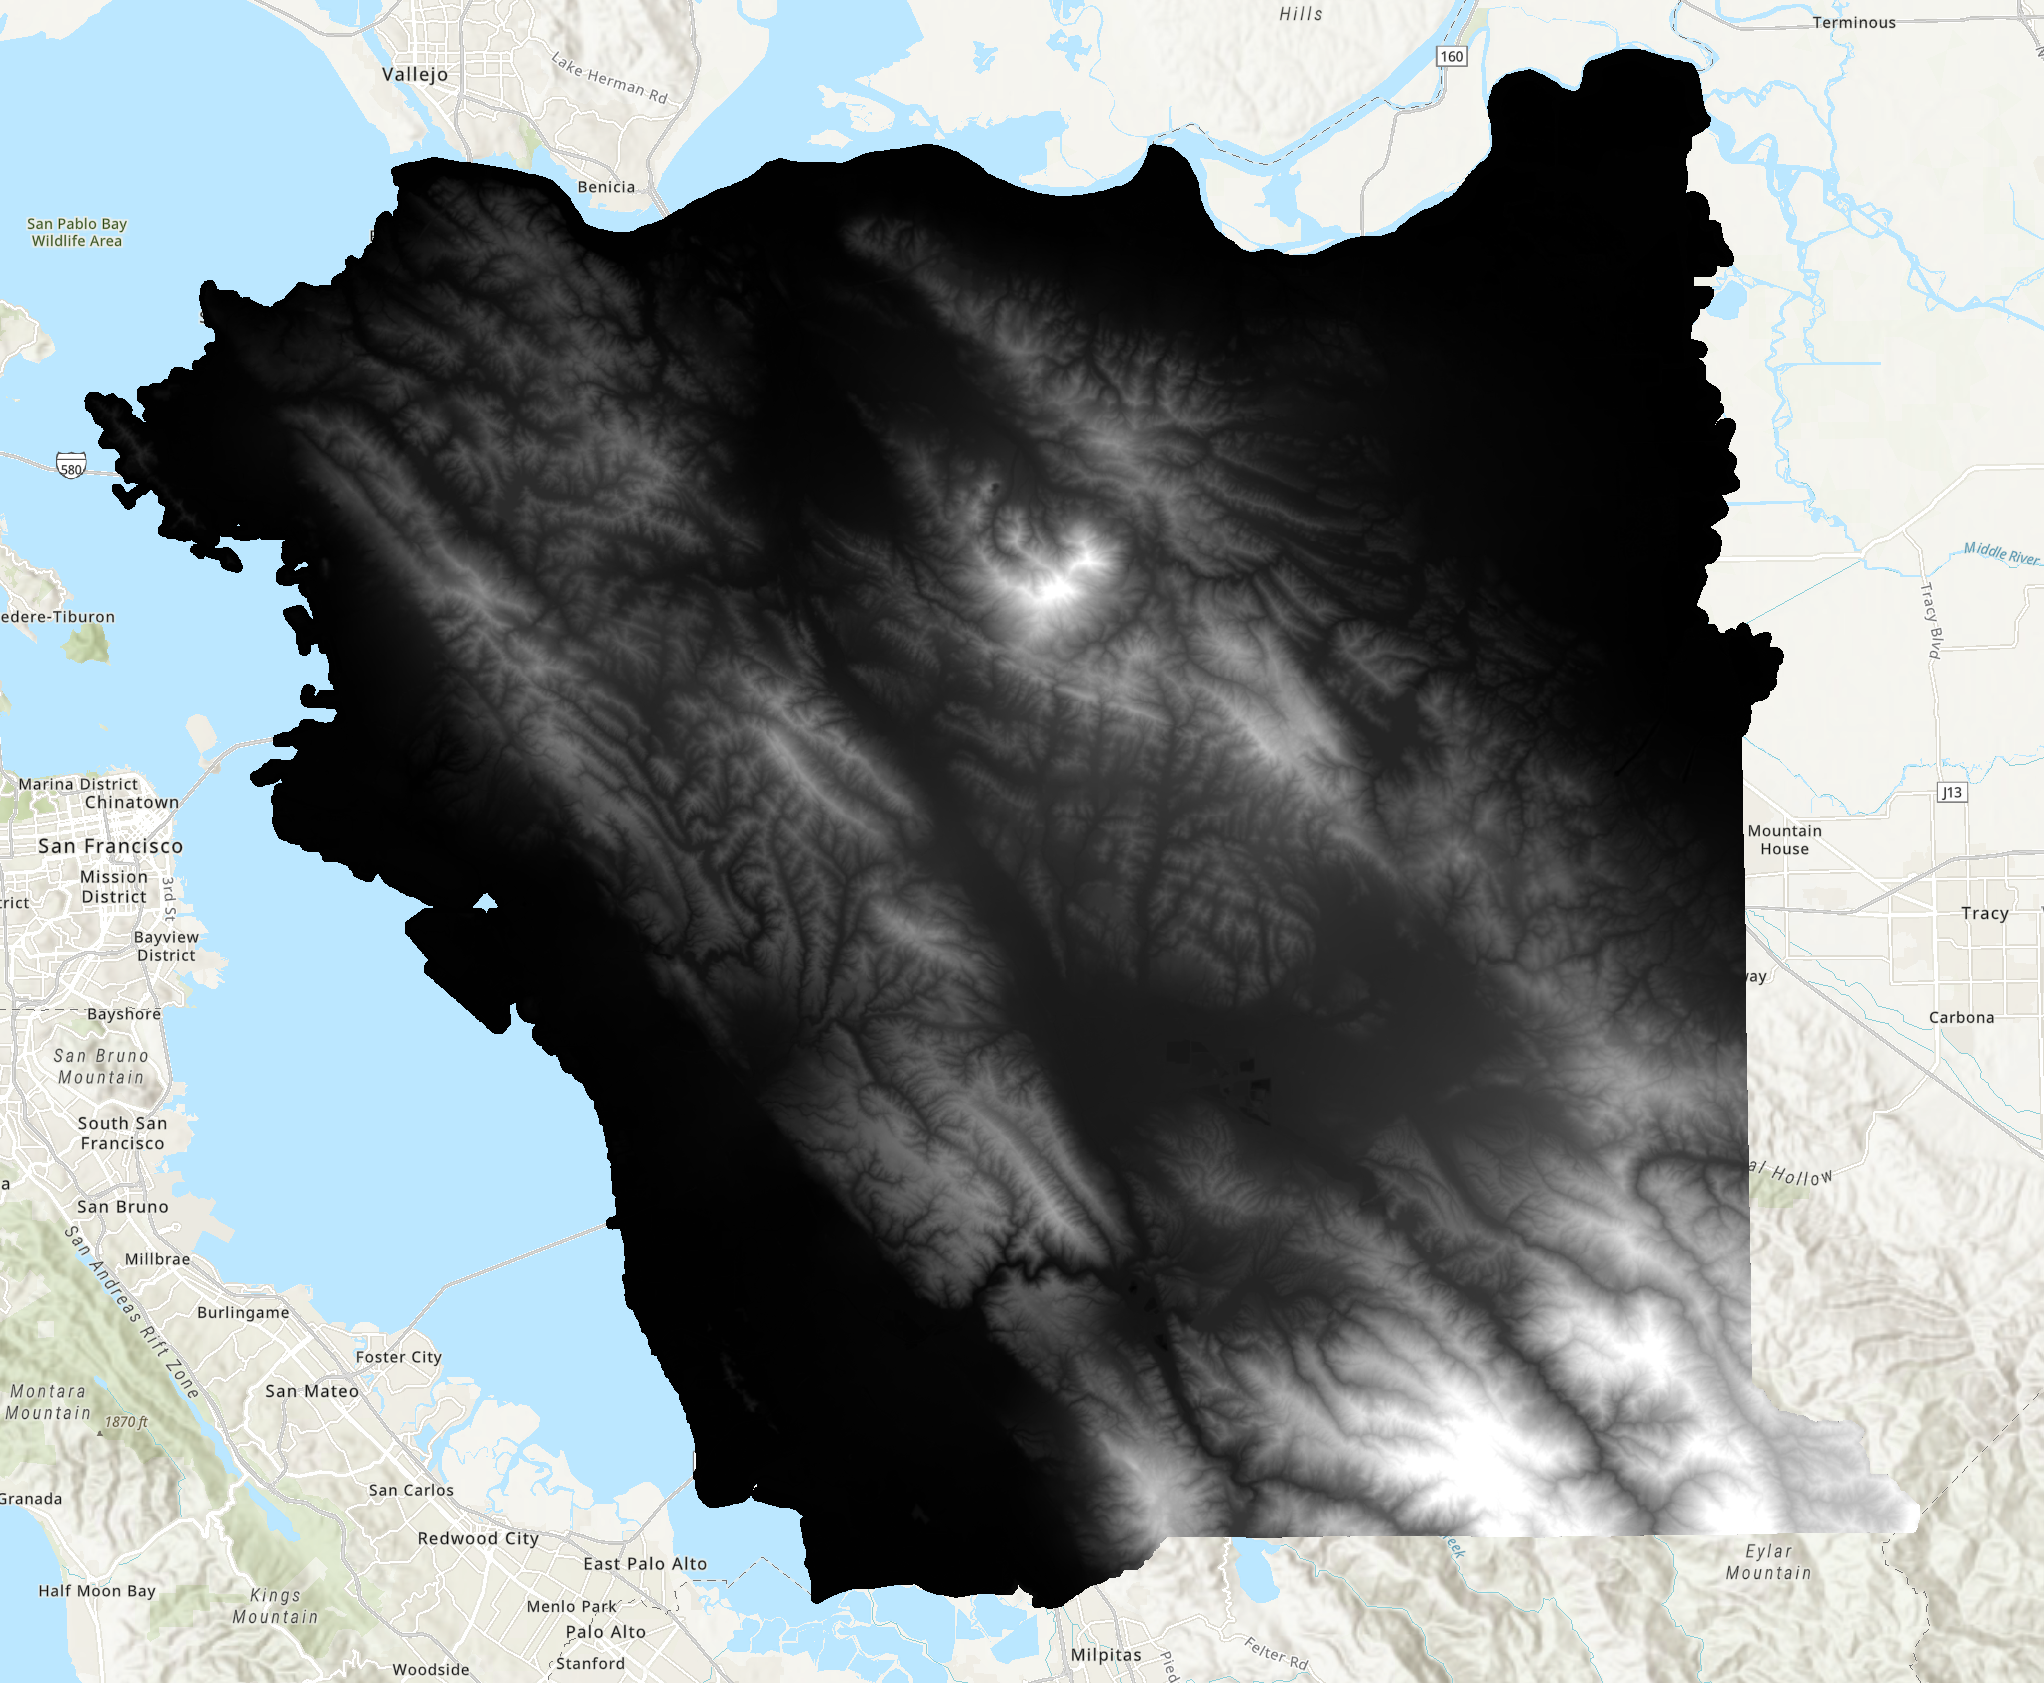 |
Fuels/Fire | Digital Terrain Model 5-meter | Raster | Alameda | Various | Various | 2023 | This raster covers Alameda and Contra Costa counties. It represents elevation above sea level (in feet) for each 5m x 5m cell. | Click Here | |||||||||||||||||||
 |
Topography | Aspect 1-meter | Raster | Contra Costa | Various | Various | 2023 | CAL FIRE, East Bay Regional Park District, and USGS | This raster covers Alameda and Contra Costa counties. In this map, aspect (or slope direction) shows the downslope direction of the maximum rate of change in elevation value from each 1m x 1m cell to its neighbors. | 1 meter | Click Here | |||||||||||||||||
 |
Forest Structure | Canopy Cover 1-meter | Raster | Contra Costa | Various | Various | 2023 | CAL FIRE, East Bay Regional Park District, and USGS | The canopy cover raster of Alameda and Contra Costa counties that represents areas of tree canopy greater than or equal to 15 feet in height with a 1, and all other areas with a 0. | 1 meter | Click Here | |||||||||||||||||
 |
Forest Structure | Canopy Height Model 1-meter | Raster | Contra Costa | Various | Various | 2023 | CAL FIRE, East Bay Regional Park District, and USGS | This raster covers Alameda and Contra Costa counties. Pixel values represent the aboveground height of vegetation and trees. | 2 meter | Click Here | |||||||||||||||||
 |
Topography | Digital Terrain Model 1-meter | Raster | Contra Costa | Various | Various | 2023 | CAL FIRE, East Bay Regional Park District, and USGS | This raster covers Alameda and Contra Costa counties. It represents elevation above sea level (in feet) for each 1m x 1m cell. | 1 meter | Click Here | |||||||||||||||||
 |
Land Cover and Fine Scale Veg | Draft - Enhanced Lifeform Map | Vector | Contra Costa | 2020 | Summer | 2023 | CAL FIRE & East Bay Regional Park District | 26-class land use and land cover map of Alameda and Contra Costa Counties | Click Here | Click Here | Click Here | ||||||||||||||||
 |
Fuels/Fire | Fuels/Fire | Raster | Contra Costa | Various | Various | 2023 | CAL FIRE, East Bay Regional Park District, and USGS | This raster provides information about the density of living and dead vegetation in the vertical stratum between 1 and 4 meters above the ground for Alameda and Contra Costa Counties. Recent research has shown that LiDAR metrics that characterize this stratum provide a useful proxy for ladder fuels. | 20 meters | Click Here | |||||||||||||||||
 |
Topography | Hillshade 1-meter | Raster | Contra Costa | Various | Various | 2023 | CAL FIRE, East Bay Regional Park District, and USGS | 1-meter resoution hillshade depicts shaded relief based on the Digital Terrain Model for Alameda and Contra Costa counties. | 1 meter | Click Here | |||||||||||||||||
 |
Built | Impervious Surfaces | Vector | Contra Costa | 2020 | Summer | 2023 | CAL FIRE & East Bay Regional Park District | The impervious map is a fine-scale polygon vector representation of all artificial impervious surfaces in Alameda and Contra Costa Counties. | Click Here | Click Here | |||||||||||||||||
 |
Topography | Slope Degrees 1-meter | Raster | Contra Costa | Various | Various | 2023 | CAL FIRE, East Bay Regional Park District, and USGS | This raster covers Alameda and Contra Costa counties. It represents steepness of the ground in degrees for each 1-meter x 1-meter raster cell. Units in degrees. | 1 meter | Click Here | |||||||||||||||||
 |
Topography | Slope Percent 1-meter | Raster | Contra Costa | Various | Various | 2023 | CAL FIRE, East Bay Regional Park District, and USGS | This raster covers Alameda and Contra Costa counties. It represents steepness of the ground in degrees for each 1-meter x 1-meter raster cell. Units in percentage rise. | 1 meter | Click Here | |||||||||||||||||
 |
Fuels/Fire | Relative Wildfire Hazard | Raster | Contra Costa | Various | Various | 2023 | CAL FIRE, East Bay Regional Park District | Modelled classified relative 20-meter wildfire hazard map for Alameda and Contra Costa Counties. | 20 meters | Click Here | Click Here | Click Here | Web Map | ||||||||||||||
 |
Fuels/Fire | Wildfire Risk to Structures | Vector | Contra Costa | Various | Various | 2023 | CAL FIRE, East Bay Regional Park District | Modelled classified relative wildfire risk to structures as 10-acre vector polygons (hexagons) for San Mateo, Santa Cruz and Santa Clara Counties | Click Here | Click Here | Click Here | Web Map | |||||||||||||||
 |
Fuels/Fire | Aspect 5-meter | Raster | Contra Costa | Various | Various | 2023 | This raster covers Alameda and Contra Costa counties. In this map, aspect (or slope direction) shows the downslope direction of the maximum rate of change in elevation value from each 5m x 5m cell to its neighbors. | Click Here | |||||||||||||||||||
 |
Fuels/Fire | Slope Degrees 5-meter | Raster | Contra Costa | Various | Various | 2023 | This raster covers Alameda and Contra Costa counties. It represents steepness of the ground in degrees for each 5-meter x 5-meter raster cell. Units in degrees. | Click Here | |||||||||||||||||||
 |
Fuels/Fire | Alameda County Fuel Model | Raster | Contra Costa | Various | Various | 2023 | This raster dataset is a 5-meter Scott and Burgan Fuel Model with Value Attribute Table, which contains fields for each component of the crosswalk. These are enhanced lifeform class (MapClass), canopy cover (AbsCover), ladder fuel (LadderFuel), canopy height (CanHeight), burn severity (BurnSeveri), pyrome (EastWest), fuel model as a numeric code (FuelModel) and fuel model as a string (FuelModTxt). | Click Here | |||||||||||||||||||
 |
Fuels/Fire | Canopy Height Model 5-meter | Raster | Contra Costa | Various | Various | 2023 | This raster covers Alameda and Contra Costa counties. Pixel values represent the aboveground height of vegetation and trees. | Click Here | |||||||||||||||||||
 |
Fuels/Fire | Canopy Cover | Raster | Contra Costa | Various | Various | 2023 | This raster covers Alameda and Contra Costa counties. In this map pixel values represent the presence or absence of tree canopy or vegetation greater than or equal to 15 feet tall. | Click Here | |||||||||||||||||||
 |
Fuels/Fire | Canopy Base Height | Raster | Contra Costa | Various | Various | 2023 | In this 5-meter raster, pixel values represent the aboveground height of vegetation and trees. | Click Here | |||||||||||||||||||
 |
Fuels/Fire | Canopy Bulk Density | Raster | Contra Costa | Various | Various | 2023 | Canopy bulk density was derived from a statewide 30-meter resolution raster from Pyrologix, and resampled to 5 meters. | Click Here | |||||||||||||||||||
 |
Fuels/Fire | Digital Terrain Model 5-meter | Raster | Contra Costa | Various | Various | 2023 | This raster covers Alameda and Contra Costa counties. It represents elevation above sea level (in feet) for each 5m x 5m cell. | Click Here | |||||||||||||||||||
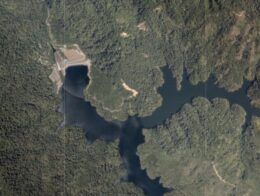 |
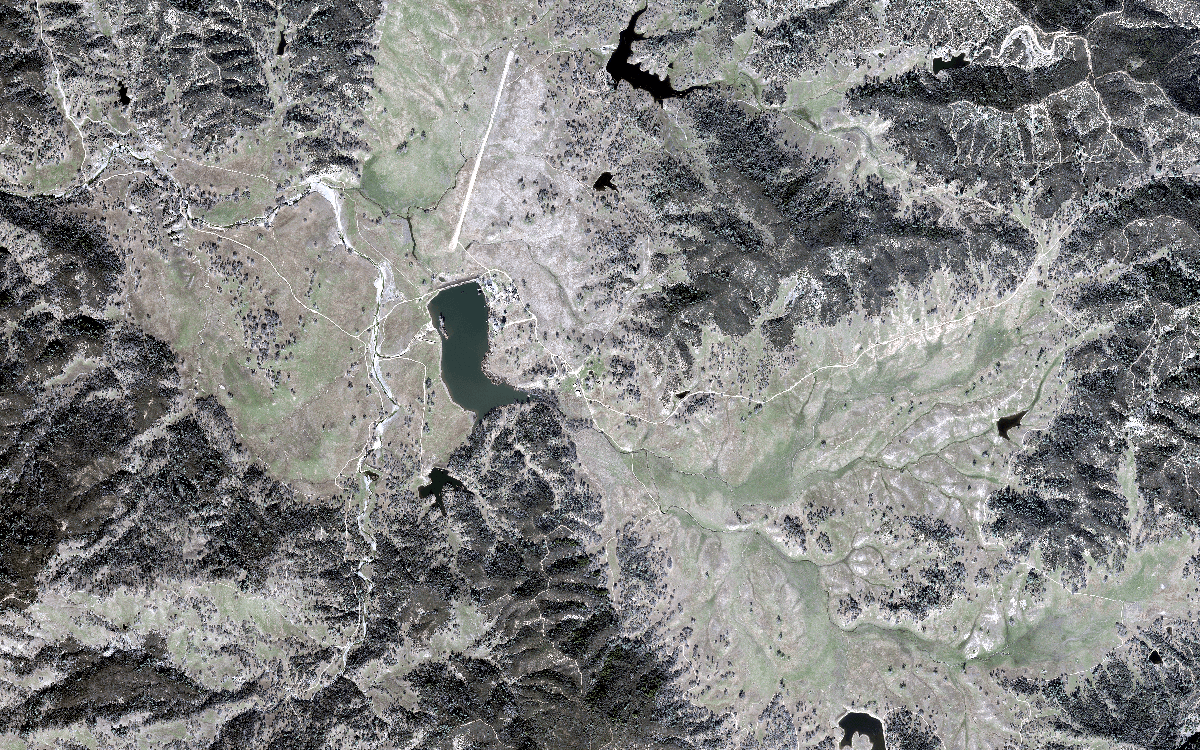
Imagery | 2018 Imagery 6-inch | Raster | Marin | 2018 | Summer | 2018 | Marin Veg Map | 6-inch, 4-band ortho imagery for Marin County | 6 inches | Click Here | Click Here | Click Here | Click Here | Click Here | Click Here | ||||||||||||
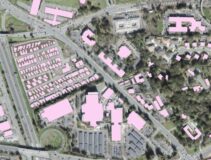 |
Built | Building Footprints and Defensible Space Areas | Vector | Marin | 2019 | Winter | 2021 | Marin Veg Map | The Marin County structure footprints and structure defensible space datasets depict 1) structurefootprints as polygons and 2) structure footprints buffered by 100 feet (defensible space areas around structures). | Click Here | Click Here | |||||||||||||||||
 |
Forest Structure | Canopy Closure 3-foot | Raster | Marin | 2019 | Winter | 2021 | Marin Veg Map | Canopy closure for Marin County based on the 2017 lidar point cloud. | 3 foot | Click Here | Click Here | Click Here | |||||||||||||||
 |
Forest Structure | Canopy Height Model 3-foot | Raster | Marin | 2019 | Winter | 2019 | Marin Veg Map | Canopy height model for Marin County based on 2019 QL 1 data. | 3 foot | Click Here | Click Here | Click Here | |||||||||||||||
 |
Topography | Digital Elevation Model (HARN) 1.5-foot | Raster | Marin | 2018 | Winter | 2019 | Marin Veg Map | Digital Elevation Model (HARN) for Marin County based on 2018 QL 1 data. | 1.5 foot | Click Here | Click Here | Click Here | Click Here | ||||||||||||||
 |
Topography | Digital Elevation Model (WGS) 1.5-foot | Raster | Marin | 2018 | Winter | 2019 | Marin Veg Map | Digital Elevation Model (WGS) for Marin County based on 2018 QL 1 data. | 1.5 foot | Click Here | Click Here | Click Here | Click Here | ||||||||||||||
 |
Forest Structure | Digital Surface Model (HARN) 1.5-foot | Raster | Marin | 2018 | Winter | 2019 | Marin Veg Map | Digital Surface Model (HARN) for Marin County based on 2018 QL 1 data. | 1.5 foot | Click Here | Click Here | Click Here | Click Here | ||||||||||||||
 |
Topography | Hillshade (HARN) 1.5-foot | Raster | Marin | 2018 | Winter | 2019 | Marin Veg Map | Hillshade (HARN) for Marin County based on 2018 QL 1 data. | 1.5 foot | Click Here | Click Here | Click Here | Click Here | ||||||||||||||
 |
Built | Impervious Surfaces | Vector | Marin | 2018 | Summer | 2021 | Marin Veg Map | The impervious map is a fine-scale polygon vector representation of all artificial impervious surfaces in Marin County. | Click Here | Click Here | Click Here | Click Here | |||||||||||||||
 |
Fuels/Fire | Ladder Fuels 64-foot | Raster | Marin | 2019 | Winter | 2019 | Marin Veg Map | Ladder fuel proxy raster for Marin County based on 2019 QL 1 data. | 64 foot | Click Here | Click Here | Click Here | |||||||||||||||
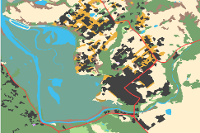 |
Land Cover and Fine Scale Veg | Lifeform Map | Vector | Marin | 2018 | Summer | 2019 | Marin Veg Map | 26-class lifeform map of Marin County. | Click Here | ||||||||||||||||||
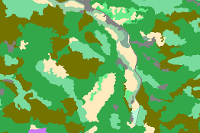 |
Land Cover and Fine Scale Veg | Marin County Fine Scale Vegetation Map | Vector | Marin | 2018 | Summer | 2021 | Marin Veg Map | 106-class fine scale vegetation map for Marin County. | Click Here | Click Here | Click Here | Click Here | Click Here | Click Here | Web Map | ||||||||||||
 |
Land Cover and Fine Scale Veg | Marin County Forest Lifeform Map | Vector | Marin | 2018 | Summer | 2021 | Marin Veg Map | Forest lifeform map for Marin County. | Click Here | ||||||||||||||||||
 |
Land Cover and Fine Scale Veg | Standardized 2004-2014 County Parks/Marin Water Vegetation Map | Vector | Marin | 2021 | Marin Veg Map | The Marin County standardized 2004-2014 map is a fine scale vegetation map combined from 3 earlier mapping efforts. This data product is meant to be used to understand vegetation conditions and how they changed between 2004 and 2014 for this subset of Marin County public lands. | Click Here | ||||||||||||||||||||
 |
Veg Classification Reports | Veg Classification, Keys, and Descriptions | Marin | 2021 | Marin Veg Map | Scroll down to 'Report' for links to classification, alliance descriptions, and keys to Marin County's vegetation communities. For relevant spatial data see the Marin Fine Scale Vegetation Map. | Classification and Floristic Key Descriptions Mapping Key | |||||||||||||||||||||
 |
Land Cover and Fine Scale Veg | Elkhorn Slough Watershed Enhanced Lifeform and Tidal Wetlands Map | Vector | Monterey | 2018 | Summer | 2020 | Elkhorn Slough Foundation, | The Elkhorn Slough watershed enhanced lifeform and tidal wetland alliance level map is a 33-class land use and land cover and alliance level tidal wetland map of Elkhorn Slough Watershed. | Click Here | Click Here | Click Here | ||||||||||||||||
 |
Land Cover and Fine Scale Veg | Napa County Vegetation Map | Vector | Napa | 2016 | 2019 | Napa County | 2016 vegetation map of Napa County (updated from the 2004 version). | Click Here | Click Here | ||||||||||||||||||
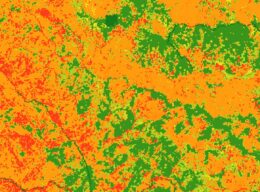 |
Fuels/Fire | Napa Fuel Model and Ladder Fuels Raster | Raster | Napa | 2018 | 2021 | Napa Communities Firewise Foundation | The Napa County FuelModel is a 5-meter spatial resolution fuel model. | 5 meters | Click Here | ||||||||||||||||||
 |
Forest Structure | Canopy Closure 3-foot | Raster | San Francisco | 2019 | 2020 | San Francisco Veg Map | The canopy closure raster depicts San Francisco County’s woody canopy that is greater than 15 feet tall as a Digital Elevation Model. | 3 foot | Click Here | ||||||||||||||||||
 |
Forest Structure | Canopy Height Model 3-foot | Raster | San Francisco | 2019 | 2020 | San Francisco Veg Map | The canopy height model represents the height above ground of vegetation. | 3 foot | Click Here | ||||||||||||||||||
 |
Forest Structure | Digital Surface Model 3-foot | Raster | San Francisco | 2019 | 2020 | San Francisco Veg Map | The Digital Surface Model (DSM) depicts topography and all objects on the earth’s surface, like trees and buildings. | 3 foot | Click Here | Click Here | |||||||||||||||||
 |
Topography | Digital Terrain Model 3-foot | Raster | San Francisco | 2019 | 2020 | San Francisco Veg Map | The DTM represents ground elevations. | 3 foot | Click Here | ||||||||||||||||||
 |
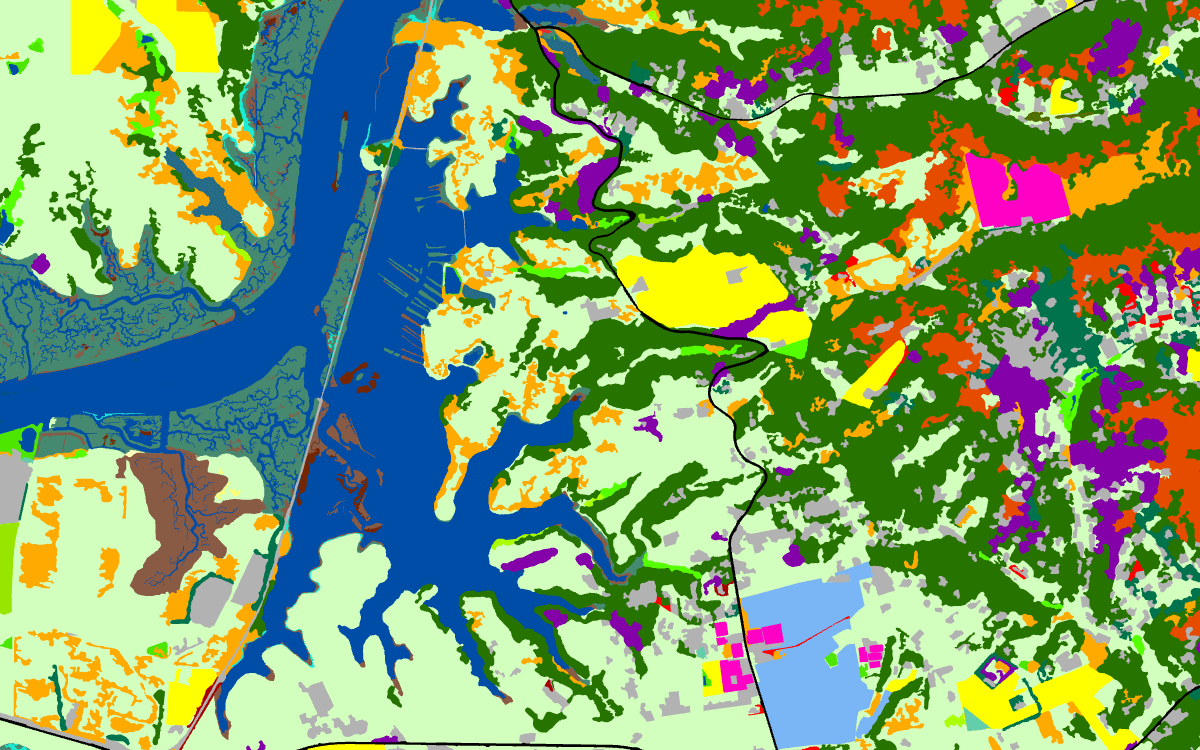
Land Cover and Fine Scale Veg | Enhanced Lifeform Map | Vector | San Francisco | 2019 | Summer | 2022 | San Francisco Veg Map | The San Francisco County enhanced lifeform map is a 20-class land use and land cover map of San Francisco County select federal lands (NPS/Presidio Trust) and San Mateo County, reflecting the state of the landscape in summer, 2018. | Click Here | Click Here | Click Here | ||||||||||||||||
 |
Topography | Hillshade 3-foot | Raster | San Francisco | 2019 | Winter | 2020 | San Francisco Veg Map | The Hillshade depicts shaded relief based on the Digital Terrain Mode. | 3 foot | Click Here | |||||||||||||||||
 |
Built | Impervious Surfaces | Vector | San Francisco | 2018 | Summer | 2021 | San Francisco Veg Map | The San Francisco County Impervious Surfaces map is a 5-class land use and land cover map of selected Federal lands in San Francisco County. | Click Here | Click Here | Click Here | ||||||||||||||||
 |
Fuels/Fire | Ladder Fuels 64-foot | Raster | San Francisco | 2019 | 2020 | San Francisco Veg Map | This LiDAR derivative provides information about the density of living and dead vegetation in the vertical stratum between 1 and 4 meters above the ground. | 64 foot | Click Here | ||||||||||||||||||
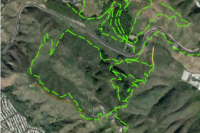 |
Built | Trail Centerlines | Vector | San Francisco | 2018 | Summer | 2021 | San Francisco Veg Map | The feature class includes centerlines for trails on Selected Federal lands. | Click Here | Click Here | Click Here | ||||||||||||||||
 |
Imagery | 2018 Imagery 6-inch | Raster | San Mateo | 2018 | Summer | 2018 | San Mateo Veg Map | 6-inch, 4-band ortho imagery for San Mateo County | 6 inches | Click Here | Click Here | Click Here | |||||||||||||||
 |
Forest Structure | Canopy Closure 3-foot | Raster | San Mateo | 2018 | Summer | 2020 | San Mateo Veg Map | Canopy closure for San Mateo County based on the 2017 lidar point cloud. | 3 foot | Click Here | |||||||||||||||||
 |
Forest Structure | Canopy Height Model 3-foot | Raster | San Mateo | 2018 | Summer | 2020 | San Mateo Veg Map | Canopy height model for San Mateo County based on the 2017 lidar point cloud. | 3 foot | Click Here | |||||||||||||||||
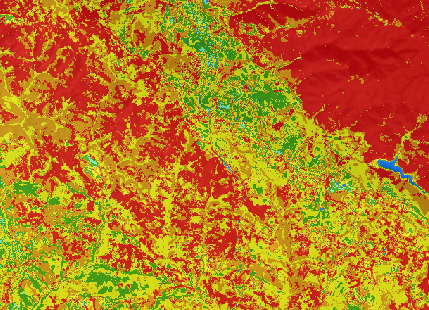 |
Fuels/Fire | Classified Wildfire Hazard 20-meter | Raster | San Mateo | 2020 | Spring | 2022 | CAL FIRE, San Mateo RCD | Modelled classified relative wildfire hazard as a 20-meter raster for San Mateo, Santa Cruz and Santa Clara Counties | 20 meters | Click Here | Click Here | https://fuelsmapping.com/3county_risk_report | |||||||||||||||
 |
Imagery | CZU Lightning Complex Postfire Imagery .5-Foot | Raster | San Mateo | 2022 | Summer | 2022 | CAL FIRE, San Mateo RCD | Six inch resolution, 4-band imagery of the CZU complex fire perimeter in San Mateo and Santa Cruz County collected in Summer, 2022 | 6 inch | Click Here | Click Here | https://vegmap.press/czu_postfire_imagery_report | Web Map | ||||||||||||||
 |
Forest Structure | CZU Postfire Canopy Cover 3-Foot | Raster | San Mateo | 2021 | Fall | 2022 | CAL FIRE & San Mateo RCD | Postfire canopy cover data for the CZU fire perimeter. | 3 foot | Click Here | Click Here | Click Here | Web Map | ||||||||||||||
 |
Forest Structure | CZU Postfire Canopy Height Model 3-Foot | Raster | San Mateo | 2021 | Fall | 2022 | CAL FIRE & San Mateo RCD | Postfire canopy height model for the CZU fire perimeter. | 3 foot | Click Here | Click Here | Click Here | Web Map | ||||||||||||||
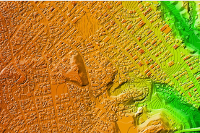 |
Forest Structure | CZU Postfire Digital Surface Model 3-Foot | Raster | San Mateo | 2021 | Fall | 2022 | CAL FIRE & San Mateo RCD | Postfire digital surface model for the CZU fire perimeter. | 3 foot | Click Here | Click Here | Click Here | Web Map | ||||||||||||||
 |
Forest Structure | CZU Postfire Digital Terrain Model 3-Foot | Raster | San Mateo | 2021 | Fall | 2022 | CAL FIRE & San Mateo RCD | Postfire digital terrain model for the CZU fire perimeter. | 3 foot | Click Here | Click Here | Click Here | Web Map | ||||||||||||||
 |
Forest Structure | CZU Postfire Lidar Hillshade 3-Foot | Raster | San Mateo | 2021 | Fall | 2022 | CAL FIRE & San Mateo RCD | Postfire lidar derived hillshade model for the CZU fire perimeter. | 3 foot | Click Here | Click Here | Click Here | Web Map | ||||||||||||||
 |
Forest Structure | CZU Postfire Lidar Intensity | Raster | San Mateo | 2021 | Fall | 2022 | CAL FIRE & San Mateo RCD | Postfire lidar intensity data for the CZU fire perimeter. | 1.5 foot | Click Here | Click Here | Click Here | Web Map | ||||||||||||||
 |
Forest Structure | CZU Postfire Normalized Digital Surface Model 3-Foot | Raster | San Mateo | 2021 | Fall | 2022 | CAL FIRE & San Mateo RCD | Postfire normalized digital surface model for the CZU fire perimeter. | 1 foot | Click Here | Click Here | Click Here | Web Map | ||||||||||||||
 |
Topography | Digital Elevation Model | Raster | San Mateo | 2017 | Spring | 2020 | San Mateo Veg Map | Digital Elevation Model for San Mateo County based on 2017 QL 2 data. | 3.28 foot | Click Here | |||||||||||||||||
 |
Land Cover and Fine Scale Veg | Enhanced Lifeform Map | Vector | San Mateo | 2018 | Summer | 2022 | San Mateo Veg Map | The San Mateo County enhanced lifeform map is a 20-class land use and land cover map of San Mateo County, reflecting the state of the landscape in summer, 2018. | Click Here | Click Here | Click Here | ||||||||||||||||
 |
Land Cover and Fine Scale Veg | Fine Scale Vegetation Map | Vector | San Mateo | 2018 | Summer | 2022 | San Mateo Veg Map | The San Mateo County fine scale vegetation map is a 106-class vegetation map of San Mateo County | Click Here | Click Here | Click Here | Click Here | Click Here for Web Map | ||||||||||||||
 |
Fuels/Fire | Fuel Model and LCP Files 5-meter | Raster | San Mateo | 2018 | Summer | 2021 | San Mateo Veg Map | Scott and Burgan surface fuel model for San Mateo County derived from fine scale vegetation, lidar-based forest structure, and other data. | 5 meters | Click Here | Click Here | ||||||||||||||||
 |
Topography | Hillshade 3-foot | Raster | San Mateo | 2017 | Spring | 2021 | San Mateo Veg Map | The 3-foot resolution hillshade raster was produced from the 2017 Digital Terrain Model using the hillshade geoprocessing tool in ArcGIS Pro. | 3 foot | Click Here | Click Here | ||||||||||||||||
 |
Built | Impervious Surfaces | Vector | San Mateo | 2018 | Summer | 2021 | San Mateo Veg Map | Impervious surfaces map for San Mateo County. | Click Here | Click Here | Click Here | ||||||||||||||||
 |
Fuels/Fire | Ladder Fuels 64-foot | Raster | San Mateo | 2017 | Spring | 2020 | San Mateo Veg Map | Ladder fuel proxy raster for San Mateo County based on the 2017 lidar point cloud. | 64 foot | Click Here | |||||||||||||||||
 |
Built | Road, Trail and Dozer Centerlines | Vector | San Mateo | 2018 | Summer | 2020 | San Mateo Veg Map | Road, trail, and dozer line centerlines for San Mateo County. | Click Here | Click Here | Click Here | ||||||||||||||||
 |
Veg Classification Reports | Veg Classification, Keys, and Descriptions | San Mateo | 2021 | San Mateo Veg Map | Scroll down to 'Report' for links to classification, alliance descriptions, and keys to San Mateo County's vegetation communities. For relevant spatial data see the San Mateo Fine Scale Vegetation Map. | Classification and Floristic Key Descriptions Mapping Key | |||||||||||||||||||||
 |
Fuels/Fire | Wildfire Risk to Structures | Vector | San Mateo | 2020 | Spring | 2022 | CAL FIRE, San Mateo RCD | Modelled classified relative wildfire risk to structures as 10-acre vector polygons (hexagons) for San Mateo, Santa Cruz and Santa Clara Counties | Click Here | Click Here | https://fuelsmapping.com/3county_risk_pdfs | https://fuelsmapping.com/3county_risk_report | |||||||||||||||
 |
Imagery | 2020 Leaf-Off Imagery 6-inch | Raster | Santa Clara | 2020 | Winter | 2020 | Santa Clara Veg Map | 3-inch and 6-inch, 4-band ortho imagery for Santa Clara County | 3 inch, 6 inch | Click Here | Click Here | Click Here | |||||||||||||||
 |
Topography | Aspect 2-foot | Raster | Santa Clara | 2020 | Winter | 2021 | Santa Clara Veg Map | This aspect raster shows the downslope direction of the maximum rate of change in elevation value from each 2-foot x 2-foot cell to its neighbors. | 2 foot | Click Here | |||||||||||||||||
 |
Topography | Aspect 5-meter | Raster | Santa Clara | 2020 | Winter | 2021 | Santa Clara Veg Map | This raster covers Santa Clara and Santa Cruz counties. In this map, aspect (or slope direction) shows the downslope direction of the maximum rate of change in elevation value from each 5m x 5m cell to its neighbors. | 5 meters | Click Here | |||||||||||||||||
 |
Forest Structure | Canopy Base Height | Raster | Santa Clara | 2020 | Winter | 2022 | Santa Clara Veg Map | In this 5-meter raster, pixel values represent the aboveground height of vegetation and trees. | 5 meters | Click Here | |||||||||||||||||
 |
Forest Structure | Canopy Bulk Density | Raster | Santa Clara | 2022 | Winter | 2022 | Santa Clara Veg Map | This canopy bulk density dataset was derived from a 10-meter resolution raster from SALO Sciences provided in February 2022. | 10 meters | Click Here | |||||||||||||||||
 |
Forest Structure | Canopy Cover 3-foot | Raster | Santa Clara | 2020 | Winter | 2021 | Santa Clara Veg Map | The canopy cover raster of Santa Clara County that represents areas of tree canopy greater than or equal to 15 feet in height with a 1, and all other areas with a 0. | 3 foot | Click Here | |||||||||||||||||
 |
Forest Structure | Canopy Cover 3-foot - Veg Returns Only | Raster | Santa Clara | 2020 | Winter | 2021 | Santa Clara Veg Map | This lidar derivative provides information about tree (and tall shrub) cover. | Click Here | ||||||||||||||||||
 |
Forest Structure | Canopy Cover 5-meter | Raster | Santa Clara | 2020 | Winter | 2021 | Santa Clara Veg Map | This raster covers Santa Clara and Santa Cruz counties. In this map pixel values represent the presence or absence of tree canopy or vegetation greater than or equal to 15 feet tall. | 5 meters | Click Here | |||||||||||||||||
 |
Forest Structure | Canopy Height Model 3-foot | Raster | Santa Clara | 2020 | Winter | 2021 | Santa Clara Veg Map | Pixel values represent the aboveground height of vegetation and trees. | 3 foot | Click Here | |||||||||||||||||
 |
Forest Structure | Canopy Height Model 5-meter | Raster | Santa Clara | 2020 | Winter | 2021 | Santa Clara Veg Map | This raster covers Santa Clara and Santa Cruz counties. Pixel values represent the aboveground height of vegetation and trees. | 5 meters | Click Here | |||||||||||||||||
 |
Fuels/Fire | Classified Wildfire Hazard 20-meter | Raster | Santa Clara | 2020 | Spring | 2022 | CAL FIRE, San Mateo RCD | Modelled classified relative wildfire hazard as a 20-meter raster for San Mateo, Santa Cruz and Santa Clara Counties | 20 meters | Click Here | Click Here | https://fuelsmapping.com/3county_risk_report | |||||||||||||||
 |
Forest Structure | Digital Surface Model 2-foot | Raster | Santa Clara | 2020 | Winter | 2021 | San Mateo RCD | 2-foot resolution hydroflattened Digital Surface Model (DSM) depicts surface topography. | 2 foot | Click Here | |||||||||||||||||
 |
Topography | Digital Terrain Model 2-foot | Raster | Santa Clara | 2020 | Winter | 2021 | San Mateo RCD | 2-foot resolution hydroflattened Digital Terrain Model (DTM) depicts bare earth topography, showing ground elevations even if they are covered with above-ground objects, such as trees and buildings. | 2 foot | Click Here | |||||||||||||||||
 |
Topography | Digital Terrrain Model 5-meter | Raster | Santa Clara | 2020 | Winter | 2021 | Santa Clara Veg Map | This raster covers Santa Clara and Santa Cruz counties. It represents elevation above sea level (in feet) for each 5m x 5m cell. | 5 meters | Click Here | |||||||||||||||||
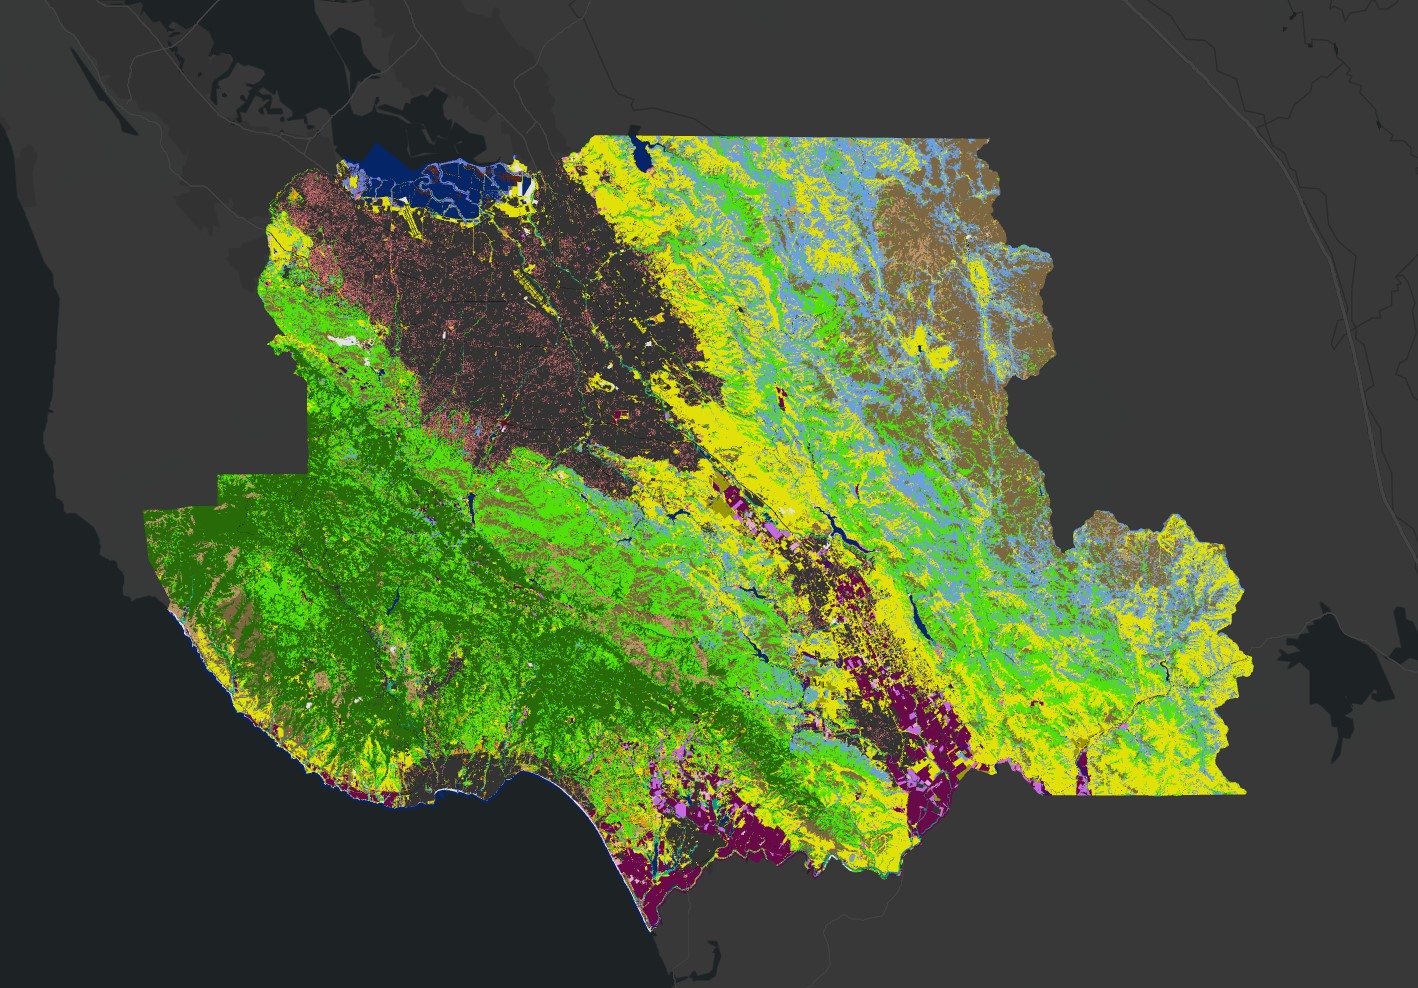 |
Land Cover and Fine Scale Veg | Enhanced Lifeform Map | Vector | Santa Clara | 2020 | Summer | 2023 | Santa Clara Veg Map | The Santa Cruz and Santa Clara counties enhanced lifeform map is a 26-class land use and land cover map of Santa Cruz and Santa Clara counties. | Click Here | Click Here | |||||||||||||||||
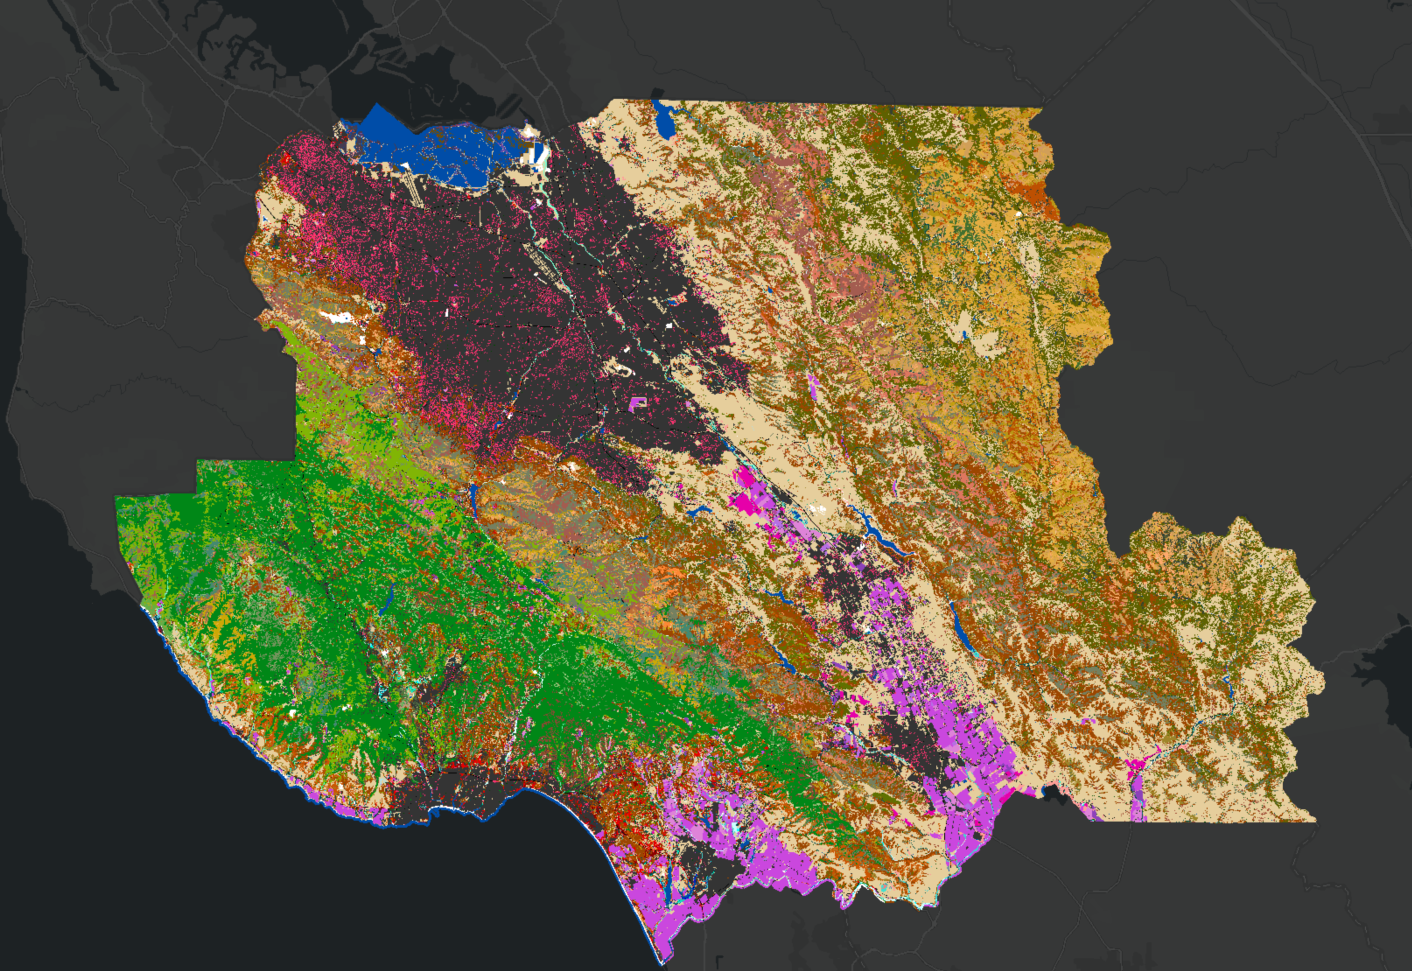 |
Land Cover and Fine Scale Veg | Fine Scale Vegetation Map | Vector | Santa Clara | 2020 | Summer | 2023 | Santa Clara Veg Map | The Santa Cruz and Santa Clara County fine scale vegetation map is a 121-class vegetation map of Santa Cruz and Santa Clara Counties. | Click Here | Click Here | Click Here | Click Here | Click Here | https://vegmap.press/cruz_clara_finescale_final_report | Web Map | ||||||||||||
 |
Topography | Hillshade 2-foot | Raster | Santa Clara | 2020 | Winter | 2021 | San Mateo RCD | 2-foot resolution hillshade depicts shaded relief based on the Digital Terrain Model. | 2 foot | Click Here | |||||||||||||||||
 |
Built | Impervious Surfaces | Vector | Santa Clara | 2020 | Winter | 2022 | Santa Clara Veg Map | The Santa Clara County Impervious Surfaces map is a 5-class fine-scale polygon vector representation of all artificial impervious surfaces in Santa Clara County. | Click Here | Click Here | Click Here | ||||||||||||||||
 |
Fuels/Fire | Ladder Fuels 64-foot | Raster | Santa Clara | 2020 | Winter | 2021 | Santa Clara Veg Map | This Santa Clara county 64-foot resolution ladder fuel raster represents the state of the landscape when countywide LiDAR data was collected in Winter, 2020. | 64 foot | Click Here | |||||||||||||||||
 |
Imagery | Post Fire Imagery - 2020 SCU Complex Fire | Raster | Santa Clara | 2020 | Fall | 2020 | Santa Clara County | 1-foot spatial resolution 4-band imagery of SCU Complex Fire in Santa Clara County, CA. Imagery Collected September 24th and 26th, 2020, from a altitude of 14,500 feet using UltraCam Eagle. Data only available at this time as a 3-band (true color) cached service for visual reference. Santa Clara County has the 4-band lossless tiffs in their possession. | Click Here | ||||||||||||||||||
 |
Fuels/Fire | Santa Clara County 5-meter Fuel Model | Raster | Santa Clara | 2020 | Winter | 2022 | Santa Clara Veg Map | This raster dataset is a 5-meter Scott and Burgan Fuel Model with Value Attribute Table, which contains fields for each component of the crosswalk. These are enhanced lifeform class (MapClass), canopy cover (AbsCover), ladder fuel (LadderFuel), canopy height (CanHeight), burn severity (BurnSeveri), pyrome (EastWest), fuel model as a numeric code (FuelModel) and fuel model as a string (FuelModTxt). | 5 meters | Click Here | |||||||||||||||||
 |
Topography | Slope Degrees 2-foot | Raster | Santa Clara | 2020 | Winter | 2021 | Santa Clara Veg Map | This slope raster depicts the steepness of the ground for each 2-foot x 2-foot cell of the raster surface. The unit is in degrees. | 2 foot | Click Here | |||||||||||||||||
 |
Topography | Slope Degrees 5-meter | Raster | Santa Clara | 2020 | Winter | 2021 | Santa Clara Veg Map | This raster covers Santa Clara and Santa Cruz counties. It represents steepness of the ground in degrees for each 5-meter x 5-meter raster cell. Units in degrees. | 5 meters | Click Here | |||||||||||||||||
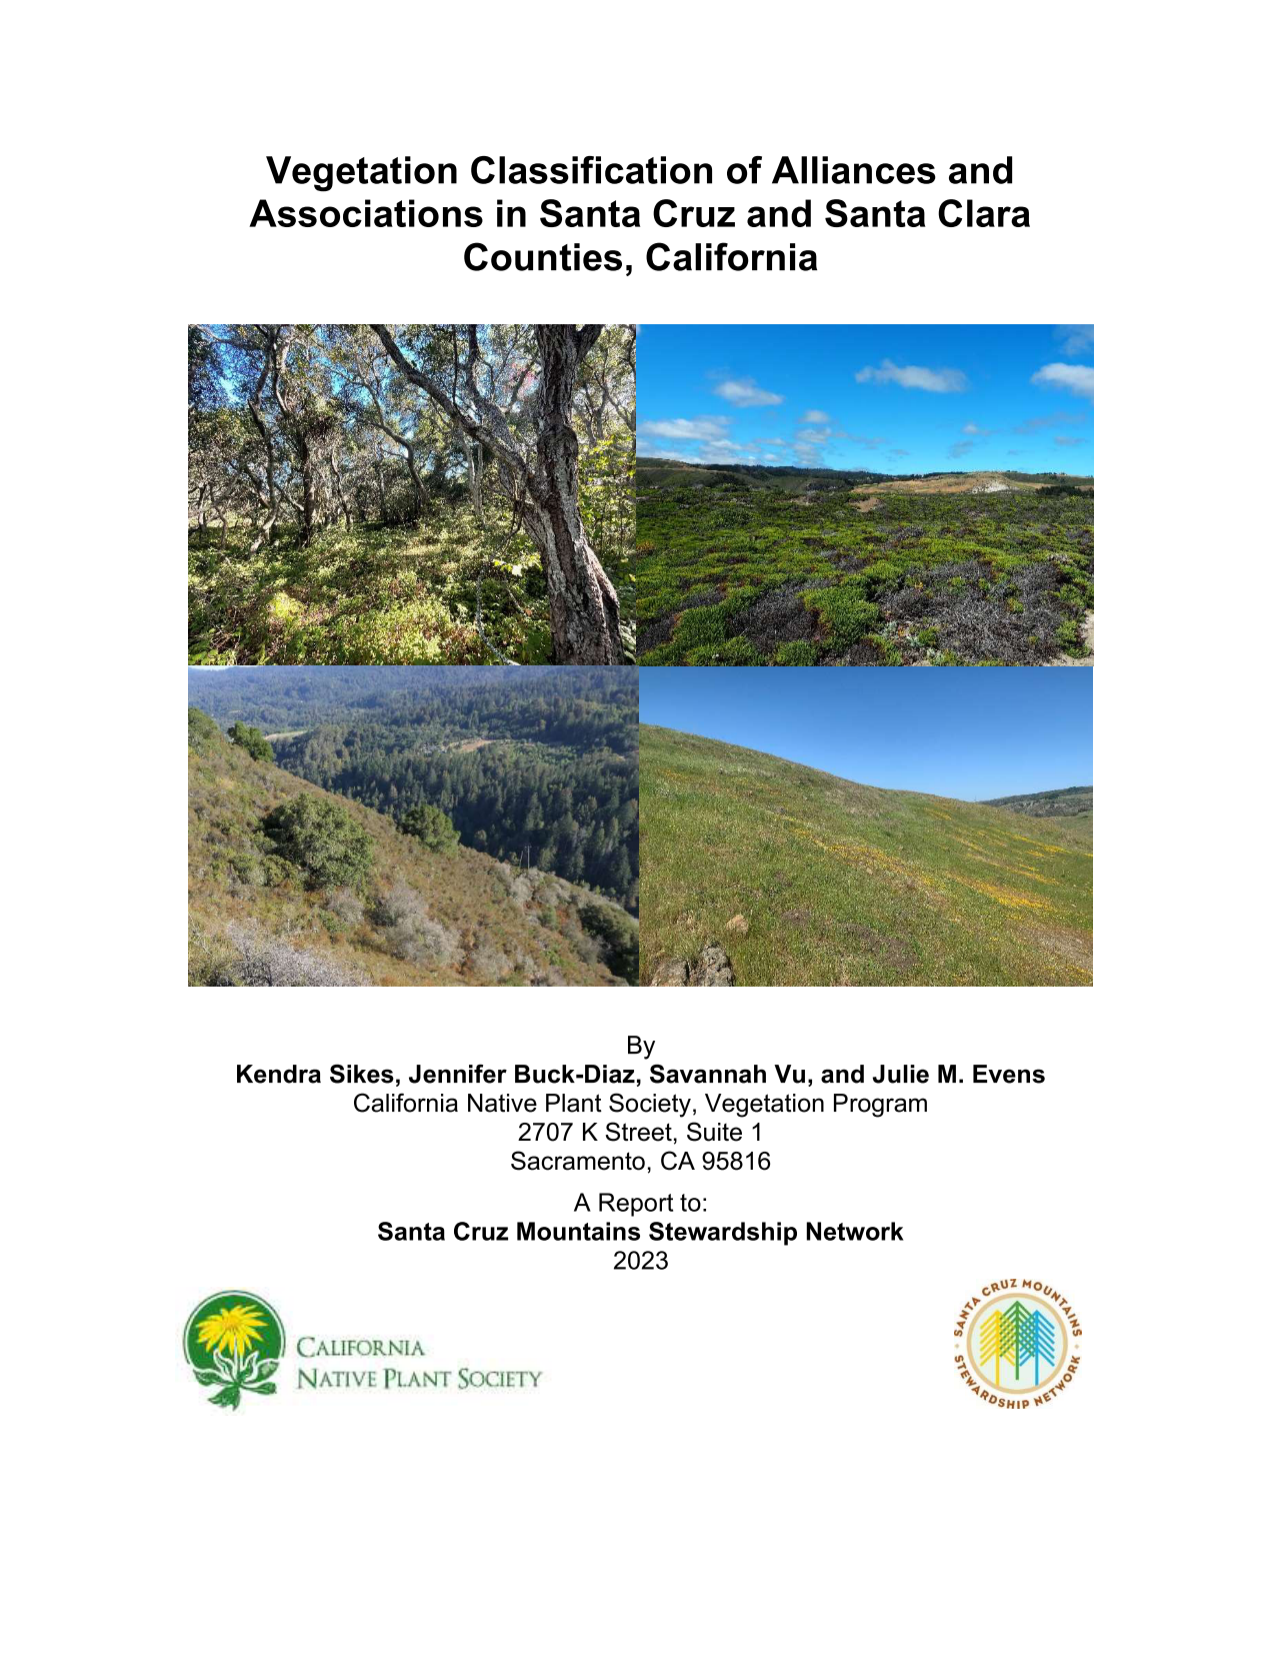 |
Veg Classification Reports | Veg Classification, Keys, and Descriptions | Santa Clara | 2023 | Santa Clara Veg Map | Scroll down to 'Report' for links to classification, alliance descriptions, and keys to Santa Cruz and Santa Clara Counties' vegetation communities. For relevant spatial data see the Santa Cruz and Santa Clara Fine Scale Vegetation Map. | Classification and Floristic Key Descriptions Mapping Key | |||||||||||||||||||||
 |
Fuels/Fire | Wildfire Risk to Structures | Vector | Santa Clara | 2020 | Spring | 2022 | CAL FIRE, San Mateo RCD | Modelled classified relative wildfire risk to structures as 10-acre vector polygons (hexagons) for San Mateo, Santa Cruz and Santa Clara Counties | Click Here | Click Here | https://fuelsmapping.com/3county_risk_pdfs | https://fuelsmapping.com/3county_risk_report | |||||||||||||||
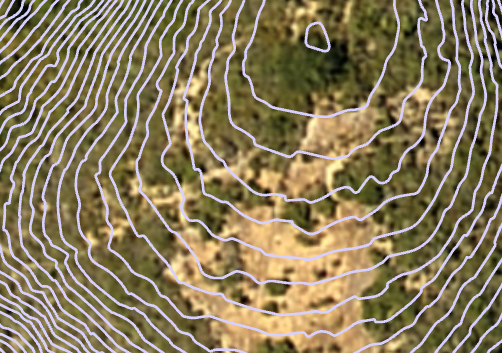 |
Contours | 2 Foot Contours | Vector | Santa Cruz | 2020 | Summer | 2022 | Santa Cruz County | Zipped file geodatabase containing 2-foot contours for all of Santa Cruz County. Data derived from quality level 1 lidar data collected in 2020 before the CZU lightning complex fire. | Click Here | ||||||||||||||||||
 |
Imagery | 2020 Imagery 6-inch | Raster | Santa Cruz | 2020 | Summer | 2020 | Santa Cruz County | 3-inch and 6-inch, 4-band ortho imagery for Santa Cruz County | 3 inch, 6 inch | Click Here | Click Here | ||||||||||||||||
 |
Topography | Aspect 2-foot | Raster | Santa Cruz | 2020 | Winter | 2021 | Santa Cruz County | This aspect raster shows the downslope direction of the maximum rate of change in elevation value from each 2-foot x 2-foot cell to its neighbors. | 2 foot | Click Here | |||||||||||||||||
 |
Topography | Aspect 5-meter | Raster | Santa Cruz | 2020 | Winter | 2021 | Santa Cruz County | This raster covers Santa Clara and Santa Cruz counties. In this map, aspect (or slope direction) shows the downslope direction of the maximum rate of change in elevation value from each 5m x 5m cell to its neighbors. | 5 meters | Click Here | |||||||||||||||||
 |
Forest Structure | Canopy Base Height | Raster | Santa Cruz | 2020 | Winter | 2022 | Santa Cruz County | In this 5-meter raster, pixel values represent the aboveground height of vegetation and trees. | 5 meters | Click Here | |||||||||||||||||
 |
Forest Structure | Canopy Bulk Density | Raster | Santa Cruz | 2022 | Winter | 2022 | Santa Cruz County | This canopy bulk density dataset was derived from a 10-meter resolution raster from SALO Sciences provided in February 2022. | 10 meters | Click Here | |||||||||||||||||
 |
Forest Structure | Canopy Cover 3-foot | Raster | Santa Cruz | 2020 | Winter | 2021 | Santa Cruz County | Canopy height model of Santa Cruz County derived from QL1 lidar. | 3 foot | Click Here | |||||||||||||||||
 |
Forest Structure | Canopy Cover 5-meter | Raster | Santa Cruz | 2020 | Winter | 2021 | Santa Cruz County | This raster covers Santa Clara and Santa Cruz counties. In this map pixel values represent the presence or absence of tree canopy or vegetation greater than or equal to 15 feet tall. | 5 meters | Click Here | |||||||||||||||||
 |
Forest Structure | Canopy Height Model 3-foot | Raster | Santa Cruz | 2020 | Winter | 2021 | Santa Cruz County | Canopy height model for Santa Cruz county based on 2020 QL 1 data. | 3 foot | Click Here | |||||||||||||||||
 |
Forest Structure | Canopy Height Model 5-meter | Raster | Santa Cruz | 2020 | Winter | 2021 | Santa Cruz County | This raster covers Santa Clara and Santa Cruz counties. Pixel values represent the aboveground height of vegetation and trees. | 5 meters | Click Here | |||||||||||||||||
 |
Fuels/Fire | Classified Wildfire Hazard 20-meter | Raster | Santa Cruz | 2020 | Spring | 2022 | CAL FIRE, San Mateo RCD | Modelled classified relative wildfire hazard as a 20-meter raster for San Mateo, Santa Cruz and Santa Clara Counties | 20 meters | Click Here | Click Here | https://fuelsmapping.com/3county_risk_report | |||||||||||||||
 |
Imagery | CZU Lightning Complex Postfire Imagery .5-Foot | Raster | Santa Cruz | 2022 | Summer | 2022 | CAL FIRE, San Mateo RCD | Six inch resolution, 4-band imagery of the CZU complex fire perimeter in San Mateo and Santa Cruz County collected in Summer, 2022 | 7 inch | Click Here | Click Here | https://vegmap.press/czu_postfire_imagery_report | Web Map | ||||||||||||||
 |
Forest Structure | CZU Postfire Canopy Cover 3-Foot | Raster | Santa Cruz | 2021 | Fall | 2022 | CAL FIRE & San Mateo RCD | Postfire canopy cover data for the CZU fire perimeter. | 3 foot | Click Here | Click Here | Click Here | Web Map | ||||||||||||||
 |
Forest Structure | CZU Postfire Canopy Height Model 3-Foot | Raster | Santa Cruz | 2021 | Fall | 2022 | CAL FIRE & San Mateo RCD | Postfire canopy height model for the CZU fire perimeter. | 3 foot | Click Here | Click Here | Click Here | Web Map | ||||||||||||||
 |
Forest Structure | CZU Postfire Digital Surface Model 3-Foot | Raster | Santa Cruz | 2021 | Fall | 2022 | CAL FIRE & San Mateo RCD | Postfire digital surface model for the CZU fire perimeter. | 3 foot | Click Here | Click Here | Click Here | Web Map | ||||||||||||||
 |
Forest Structure | CZU Postfire Digital Terrain Model 3-Foot | Raster | Santa Cruz | 2021 | Fall | 2022 | CAL FIRE & San Mateo RCD | Postfire digital terrain model for the CZU fire perimeter. | 3 foot | Click Here | Click Here | Click Here | Web Map | ||||||||||||||
 |
Forest Structure | CZU Postfire Lidar Hillshade 3-Foot | Raster | Santa Cruz | 2021 | Fall | 2022 | CAL FIRE & San Mateo RCD | Postfire lidar derived hillshade model for the CZU fire perimeter. | 3 foot | Click Here | Click Here | Click Here | Web Map | ||||||||||||||
 |
Forest Structure | CZU Postfire Lidar Intensity | Raster | Santa Cruz | 2021 | Fall | 2022 | CAL FIRE & San Mateo RCD | Postfire lidar intensity data for the CZU fire perimeter. | 1.5 foot | Click Here | Click Here | Click Here | Web Map | ||||||||||||||
 |
Forest Structure | CZU Postfire Normalized Digital Surface Model 3-Foot | Raster | Santa Cruz | 2021 | Fall | 2022 | CAL FIRE & San Mateo RCD | Postfire normalized digital surface model for the CZU fire perimeter. | 1 foot | Click Here | Click Here | Click Here | Web Map | ||||||||||||||
 |
Forest Structure | Digital Surface Model 3-foot | Raster | Santa Cruz | 2020 | Winter | 2020 | Santa Cruz County | Digital surface model for Santa Cruz county based on 2020 QL 1 data. | 3 foot | Click Here | |||||||||||||||||
 |
Topography | Digital Terrain Model – Eastern Santa Cruz County 2-foot | Raster | Santa Cruz | 2020 | Winter | 2021 | Santa Cruz County | Digital Terrain Model (DTM) depicts topography, while removing all above-ground objects on the earth’s surface, like trees and buildings. | 2 foot | Click Here | |||||||||||||||||
 |
Topography | Digital Terrain Model – Western Santa Cruz County 2-foot | Raster | Santa Cruz | 2020 | Winter | 2021 | Santa Cruz County | Digital Terrain Model (DTM) depicts topography, while removing all above-ground objects on the earth’s surface, like trees and buildings. | 2 foot | Click Here | |||||||||||||||||
 |
Topography | Digital Terrain Model 5-meter | Raster | Santa Cruz | 2020 | Winter | 2021 | Santa Cruz County | This raster covers Santa Clara and Santa Cruz counties. It represents elevation above sea level (in feet) for each 5m x 5m cell. | 5 meters | Click Here | |||||||||||||||||
 |
Land Cover and Fine Scale Veg | Enhanced Lifeform Map | Vector | Santa Cruz | 2020 | Summer | 2023 | Santa Cruz County | The Santa Cruz and Santa Clara counties enhanced lifeform map is a 26-class land use and land cover map of Santa Cruz and Santa Clara counties. | Click Here | Click Here | |||||||||||||||||
 |
Land Cover and Fine Scale Veg | Fine Scale Vegetation Map | Vector | Santa Cruz | 2020 | Summer | 2023 | Santa Cruz County | The Santa Cruz and Santa Clara County fine scale vegetation map is a 121-class vegetation map of Santa Cruz and Santa Clara Counties. | Click Here | Click Here | Click Here | Click Here | Click Here | https://vegmap.press/cruz_clara_finescale_final_report | Web Map | ||||||||||||
 |
Topography | Hillshade 2-foot | Raster | Santa Cruz | 2020 | Winter | 2021 | Santa Cruz County | Bare earth hillshade for Santa Cruz county based on 2020 QL 1 data and 2018 QL2 data. | 2 foot | Click Here | |||||||||||||||||
 |
Built | Impervious Surfaces | Vector | Santa Cruz | 2020 | Summer | 2022 | Santa Cruz Veg Map | The Santa Cruz County Impervious Surfaces map is a 5-class fine-scale polygon vector representation of all artificial impervious surfaces in Santa Cruz County. | Click Here | Click Here | Click Here | ||||||||||||||||
 |
Fuels/Fire | Ladder Fuels 64-foot | Raster | Santa Cruz | 2020 | Winter | 2022 | Santa Cruz County | This raster provides information about the density of living and dead vegetation in the vertical stratum between 1 and 4 meters above the ground. Recent research has shown that LiDAR metrics that characterize this stratum provide a useful proxy for ladder fuels. | 64-foot | Click Here | |||||||||||||||||
 |
Forest Structure | Normalized Digital Surface Model 3-foot | Raster | Santa Cruz | 2020 | Winter | 2020 | Santa Cruz County | Normalized digital surface model for Santa Cruz county based on 2020 QL 1 data. | 3 foot | Click Here | |||||||||||||||||
 |
Fuels/Fire | Santa Cruz County 5-meter Fuel Model | Raster | Santa Cruz | 2020 | Winter | 2022 | Santa Cruz County | This raster dataset is a 5-meter Scott and Burgan Fuel Model with Value Attribute Table, which contains fields for each component of the crosswalk. These are enhanced lifeform class (MapClass), canopy cover (AbsCover), ladder fuel (LadderFuel), canopy height (CanHeight), burn severity (BurnSeveri), pyrome (EastWest), fuel model as a numeric code (FuelModel) and fuel model as a string (FuelModTxt). | 5 meters | Click Here | |||||||||||||||||
 |
Topography | Slope Degrees 2-foot | Raster | Santa Cruz | 2020 | Winter | 2021 | Santa Cruz County | This slope raster depicts the steepness of the ground for each 2-foot x 2-foot cell of the raster surface. The unit is in degrees. | 2 foot | Click Here | |||||||||||||||||
 |
Topography | Slope Degrees 5-meter | Raster | Santa Cruz | 2020 | Winter | 2021 | Santa Cruz County | This raster covers Santa Clara and Santa Cruz counties. It represents steepness of the ground in degrees for each 5-meter x 5-meter raster cell. Units in degrees. | 5 meters | Click Here | |||||||||||||||||
 |
Topography | Slope Percent 2-foot | Raster | Santa Cruz | 2020 | Winter | 2021 | Santa Cruz County | This slope raster depicts the steepness of the ground for each 2-foot x 2-foot cell of the raster surface. The unit is in percentage rise. | 2 foot | Click Here | |||||||||||||||||
 |
Veg Classification Reports | Veg Classification, Keys, and Descriptions | Santa Cruz | 2023 | Santa Cruz County | Scroll down to 'Report' for links to classification, alliance descriptions, and keys to Santa Cruz and Santa Clara Counties' vegetation communities. For relevant spatial data see the Santa Cruz and Santa Clara Fine Scale Vegetation Map. | Classification and Floristic Key Descriptions Mapping Key | |||||||||||||||||||||
 |
Fuels/Fire | Wildfire Risk to Structures | Vector | Santa Cruz | 2020 | Spring | 2022 | CAL FIRE, San Mateo RCD | Modelled classified relative wildfire risk to structures as 10-acre vector polygons (hexagons) for San Mateo, Santa Cruz and Santa Clara Counties | Click Here | Click Here | https://fuelsmapping.com/3county_risk_pdfs | https://fuelsmapping.com/3county_risk_report | |||||||||||||||
 |
Hydrology | Hydro Data Products | Raster | Sonoma | 2013 | Fall | 2016 | Sonoma Veg Map | Vector products include stream centerlines, confluence points, hydroenforcement burn locations, and watersheds. | Click Here | ||||||||||||||||||
 |
Contours | 1 Foot Contours | Vector | Sonoma | 2013 | Fall | 2014 | Sonoma Veg Map | Lidar derived 1-foot contours for Sonoma County. | Click Here | Winter 2020 lidar data | |||||||||||||||||
| Imagery | 2011 Imagery 6-inch | Raster | Sonoma | 2011 | Fall | 2011 | Sonoma County | 3-band, 2011 Orthoimagery for Sonoma County | 6 inch | Click Here | Click Here | |||||||||||||||||
 |
Imagery | 2013 Imagery 6-inch | Raster | Sonoma | 2013 | Fall | 2014 | NASA/Sonoma Veg Map | 3-band, 2013 Orthoimagery for Sonoma County | 6 inch | Click Here | Click Here | ||||||||||||||||
 |
Imagery | 2018 Imagery | Raster | Sonoma | 2018 | Spring | 2019 | Sonoma County | 4-band, 2018 Orthoimagery for Sonoma County | 6 inch | 6-inch | Click Here | ||||||||||||||||
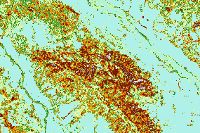 |
Land Cover and Fine Scale Veg | Aboveground Biomass | Raster | Sonoma | 2013 | Fall | 2017 | Sonoma Veg Map | Sonoma County aboveground CO2e map. | 30 meters | Click Here | Click Here | Click Here | |||||||||||||||
 |
Built | Building Footprints | Vector | Sonoma | 2013 | Fall | 2014 | Sonoma Veg Map | Building footprints for Sonoma County | Click Here | Click Here | |||||||||||||||||
 |
Forest Structure | Canopy Cover 3-foot | Raster | Sonoma | 2013 | Fall | 2014 | Sonoma Veg Map | Lidar derived canopy cover for Sonoma County. | 3 foot | See watershed downloads | Click Here | Click Here | 2018 lidar data | ||||||||||||||
 |
Forest Structure | Canopy Damage Maps | Raster | Sonoma | 2018 | Summer | 2018 | NASA | Canopy Damage Maps – 2017 Sonoma County Fires | 1 foot | Click Here | Click Here | ||||||||||||||||
 |
Forest Structure | Canopy Height Model 1-meter | Raster | Sonoma | 2013 | Fall | 2014 | Sonoma Veg Map | Lidar derived canopy height model. | 1 meter | Click Here | Click Here | Click Here | Click Here | ||||||||||||||
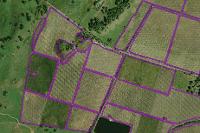 |
Land Cover and Fine Scale Veg | Croplands | Vector | Sonoma | 2013 | Fall | 2017 | Sonoma Veg Map | Sonoma County croplands data. | Click Here | Click Here | Click Here | ||||||||||||||||
 |
Topography | Digital Terrain Model 3-foot | Raster | Sonoma | 2013 | Fall | 2014 | Sonoma Veg Map | Lidar derived Bare earth digital elevation model. | 3 foot | Click Here | Click Here | Click Here | 2017 lidar data | Click Here | |||||||||||||
 |
Land Cover and Fine Scale Veg | Fine Scale Vegetation Map | Vector | Sonoma | 2013 | Fall | 2017 | Sonoma Veg Map | Fine scale vegetation map for Sonoma County. | Click Here | Click Here | Click Here | Click Here | Click Here | Click Here | https://sonomaopenspace.egnyte.com/dl/1SWyCSirE9 | ||||||||||||
 |
Land Cover and Fine Scale Veg | Forest Lifeform | Vector | Sonoma | 2013 | Fall | 2017 | Sonoma Veg Map | Sonoma County forest lifeform map | Click Here | Click Here | |||||||||||||||||
 |
Fuels/Fire | Fuel Model | Raster | Sonoma | 2013 | Fall | 2021 | Pepperwood Foundation | Sonoma County 5-meter Fuel Model as a map service for all of Sonoma County | 5 meters | Click Here | Click Here | ||||||||||||||||
 |
Fuels/Fire | Fuel Model and LCP Files 5-meter | Raster | Sonoma | 2018 | Summer | 2019 | Pepperwood Foundation | Scott and Burgan surface fuel model for Sonoma County derived from fine scale vegetation, lidar-based forest structure, and other data. | 5 meters | Click Here | Click Here | ||||||||||||||||
 |
Fuels/Fire | Fuels/Fire | Raster | Sonoma | 2013 | Fall | 2019 | NASA | 64-foot resolution image service of LiDAR-derived ladder fuels in 6 classes. | 64 foot | Click Here | Click Here | ||||||||||||||||
 |
Topography | Hillshade 3-foot | Raster | Sonoma | 2013 | Fall | 2014 | Sonoma Veg Map | Lidar derived bare earth hillshade. | 3 foot | Click Here | Click Here | Click Here | |||||||||||||||
 |
Built | Impervious Surfaces | Vector | Sonoma | 2013 | Fall | 2015 | Sonoma Veg Map | Impervious surfaces map for Sonoma County. | Click Here | Click Here | Click Here | https://sonomaopenspace.egnyte.com/dl/V3C5vTG4Mm | |||||||||||||||
 |
Other | Intensity Raster - First Returns 3-foot | Raster | Sonoma | 2013 | Fall | 2014 | Sonoma Veg Map | This intensity image depicts intensity values in their native radiometric resolution for LiDAR first; intensities measure the magnitude (strength) of a return pulse. | 3 foot | Click Here | Click Here | Click Here | Click Here | ||||||||||||||
 |
Other | Intensity Raster - Veg. Returns 3-foot | Raster | Sonoma | 2013 | Fall | 2014 | Sonoma Veg Map | This intensity image depicts intensity values in their native radiometric resolution for LiDAR veg returns; intensities measure the magnitude (strength) of a return pulse. | 3 foot | Click Here | Click Here | Click Here | Click Here | ||||||||||||||
 |
Fuels/Fire | Ladder Fuels 64-foot | Raster | Sonoma | 2013 | Fall | 2019 | Pepperwood Foundation | 64-foot resolution image service of LiDAR-derived ladder fuels. | 64 foot | Click Here | Click Here | ||||||||||||||||
 |
Land Cover and Fine Scale Veg | Lifeform Map | Vector | Sonoma | 2013 | Fall | 2017 | Sonoma Veg Map | Lifeform map of Sonoma County. | Click Here | Click Here | Click Here | ||||||||||||||||
 |
Imagery | Post Fire Imagery - 2017 Sonoma County Burned Areas 1-foot | Raster | Sonoma | 2018 | Summer | 2018 | NASA | 1-foot spatial resolution 4-band imagery of Nunns, Tubbs, and Pocket fire perimeters in Sonoma County California. Imagery Collected June 14, 2018. | 1 foot | Click Here | Click Here | ||||||||||||||||
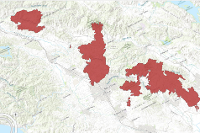 |
Other | Revised 2017 Sonoma County Fire-Perimeters | Vector | Sonoma | 2018 | Summer | 2018 | NASA | Revised fire perimeters for the 2017 Nuns, Tubbs, and Pocket Fires | Click Here | ||||||||||||||||||
| Veg Classification Reports | Veg Classification, Keys, and Descriptions | Sonoma | 2014 | Sonoma Veg Map | Scroll down to 'Report' for links to classification, alliance descriptions, and keys to Sonoma County's vegetation communities. For relevant spatial data see the Sonoma County Fine Scale Vegetation Map. | Classification and Floristic Key Descriptions Mapping Key | ||||||||||||||||||||||
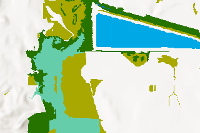 |
Land Cover and Fine Scale Veg | Water and Wetland Vegetation | Vector | Sonoma | 2013 | Fall | 2017 | Sonoma Veg Map | Sonoma County water and wetlands map | Click Here | Click Here | Click Here | ||||||||||||||||
 |
Fuels/Fire | Wildfire Hazard Index 96-foot | Raster | Sonoma | 2018 | Summer | 2021 | Sonoma County PRMD | Modelled index of relative wildfire hazard in Sonoma County. | 96 foot | Click Here | |||||||||||||||||
 |
Fuels/Fire | Annual Wildfire Burn Probability 30-meter | Raster | Statewide | 2019 | Summer | 2021 | USDA Forest Service | Statewide annual burn probability from Pyrologix, updated in 2021. | 30 meters | Click Here | Click Here | ||||||||||||||||
 |
Fuels/Fire | Conditional Ember Load Index 30-meter | Raster | Statewide | 2019 | Summer | 2021 | USDA Forest Service | Statewide conditional ember load index from Pryologix, updated in 2021. | 30 meters | Click Here | Click Here | ||||||||||||||||
 |
Fuels/Fire | Ember Load Index 30-meter | Raster | Statewide | 2019 | Summer | 2021 | USDA Forest Service | Statewide ember load index from Pryologix, updated in 2021. | 30 meters | Click Here | Click Here | ||||||||||||||||
 |
Fuels/Fire | Fuel Model and LCP Files 30-meter | Raster | Statewide | 2019 | Summer | 2021 | USDA Forest Service | Statewide 30-meter fuelscape from Pyrologix, updated in 2021. | 30 meters | Click Here | Click Here | ||||||||||||||||
 |
Fuels/Fire | Suppression Difficulty Index 30-meter | Raster | Statewide | 2019 | Summer | 2021 | USDA Forest Service | Statewide suppression difficulty index from Pyrologix, updated in 2021. | 30 meters | Click Here | Click Here | ||||||||||||||||
 |
Fuels/Fire | Wildfire Hazard 30-meter | Raster | Statewide | 2019 | Summer | 2021 | USDA Forest Service | Statewide wildfire hazard potential from Pyrologix, updated in 2021. | 30 meters | Click Here | Click Here | ||||||||||||||||
| Fuels/Fire | CZU Fire Canopy Damage Map | Vector | Santa Cruz | 2022 | Summer | 2024 | CAL FIRE | This is polygon map of woody canopy damage as a result of the 2020 CZU fire in San Mateo and Santa Cruz County. The map provides information on the percent of the forest canopy that was visibly damaged in post-fire Quality Level 1 lidar and 1-foot resolution post-fire imagery. | Click Here | Click Here | ||||||||||||||||||
| Fuels/Fire | CZU Fire Canopy Damage Map | Vector | San Mateo | 2022 | Summer | 2024 | CAL FIRE | This is polygon map of woody canopy damage as a result of the 2020 CZU fire in San Mateo and Santa Cruz County. The map provides information on the percent of the forest canopy that was visibly damaged in post-fire Quality Level 1 lidar and 1-foot resolution post-fire imagery. | Click Here | Click Here | ||||||||||||||||||
 |
Forest Structure | Canopy Height Model 3-foot - Veg Returns Only | Raster | Santa Clara | 2020 | Winter | 2021 | Santa Clara Veg Map | Pixel values represent the aboveground height of vegetation and trees - this was created from ONLY point cloud returns classified as 'Vegetation' | 3 foot | Click Here | |||||||||||||||||
| Map Category | County or Region |
Image:
Map Category:
Dataset Name:
Vector or Raster:
County or Region:
Ground Condition Year:
Ground Condition Season:
Data Publishing Year:
Description:
Raster Spatial Resolution:
Raster Data:
Feature Class:
Feature or Image Service:
Tile Service:
Layer Package:
Layer File:
Watershed Downloads:
Clip and Email Viewer:
PDF Maps:
Methods:
Datasheet:
Report:
Other Info:
Large Area Downloads: